Sunday, May 30, 2010

SQL Server Report Builder 3.0 for SQL 2008 R2 is available for download.

With every new version of SQL Server, a new version of the report builder is made. For SQL 2008 R2, version 3.0 is made. Report Builder 3.0 introduces additional visualizations including maps, sparklines and databars which can help produce new insights well beyond what can be achieved with standard tables and charts. The Report Part Gallery is also included in this release. With report parts, work groups can now take advantage of the different strengths and roles of their team members. For example, if you are responsible for creating charts, you can save your charts as separate parts that you and your coworkers can reuse in other reports. You can publish report parts on a report server or SharePoint site integrated with a report server. You can reuse them in multiple reports, and you can update them on the server.

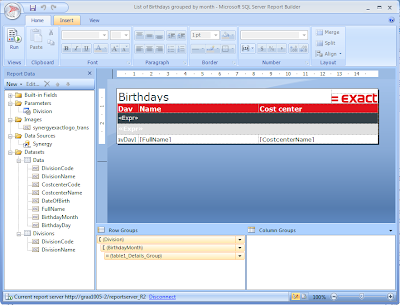
Here are some screen shots of the Report Builder 3.0:
The New Report wizards for Table or Matrix, Charts, Maps.

The toolbar:


Maintaining a report:
Report Builder is a good tool for customers and consultants to build and maintain their reports. It's much more user friendly in comparison with SQL Server Business Intelligence Development Studio. To download Report Builder 3.0 click here. Unfortunately, their is only a 32 bits version available of Report Builder 3.0.

Enjoy building nice reports for your customers.

Wednesday, May 26, 2010

When to use the INCLUDE option in the CREATE INDEX statement.

In SQL 2005\2008\2008 R2 you can create non clustered indexes with the INCLUDE option. Sometimes I got questions why you should use the INCLUDE option. In this blog I will explain why and when you should use it. An index will store all data in the order of the content of the indexed columns. Assume we have created next index:

CREATE INDEX MyIndexName ON MyTable (ColumnA, ColumnB, ColumnC)

All data will be stored first on ColumnA and then on ColumnB and then on ColumnC. Let's take next records:
ColumnA, ColumnB, ColumnC
Record 1: XX,YY,1
Record 2: XX,YY,6
Record 3: XX,YY,10
Record 4: XX,YY,15
Record 5: XX,YY,50

Assume the value 50 of columnC of record 5 will change to 2. With the MyIndexName on MyTable the records in the index will be re-ordered.

ColumnA, ColumnB, ColumnC

Record 1: XX,YY,1
Record 5: XX,YY,2
Record 2: XX,YY,6
Record 3: XX,YY,10
Record 4: XX,YY,15

This will cost disk I/O to change the index order and can result in index defragmentation.

With the INCLUDE option the index records will not be re-ordered for changes in the values of INCLUDE columns.
CREATE INDEX MyIndexName2 ON MyTable (ColumnA, ColumnB) INCLUDE (ColumnC)

So a change in the value of ColumnC will not result in a index re order. Only the value of Column C is updated.

ColumnA, ColumnB, ColumnC

Record 1: XX,YY,1
Record 2: XX,YY,6
Record 3: XX,YY,10
Record 4: XX,YY,15
Record 5: XX,YY,2

When to use the INCLUDE option? Answer to this question is really simple. In case you want to create a covering index:
Anything in the WHERE clause would be a key, anything in the SELECT would be an included column.

Example next query:
SELECT ColumnC FROM MyTable WHERE ColumA = 'XX' AND ColumnB = 'YY'

For this query MyIndexName2 is much more efficient.

Monday, May 24, 2010

Exact Synergy Enterprise with MS Reporting services (SSRS) now available.


As of 20 may 2010 Exact Synergy Enterprise product update 243 is general available. In this product update the first step is made in the integration of Microsoft Reporting Services. This enables the users of Exact Synergy Enterprise to build their own reports and run the reports within the Exact Synergy Enterprise interface. In combination with the latest SQL 2008 R2 release, you can transform data into information. All new added features in SQL 2008 R2 like indicators, data bars, spark lines, maps etc can be used in your reports.
For a small preview about this integration please have a look to this video.

Enjoy building nice reports on your Synergy database please keep in mind some tips to improve the performance of your SSRS reports.

Monday, May 17, 2010

Deprecated Database Engine Features in SQL 2008 R2

Every time a new SQL Version is coming to the market people are interested in the new features. I did the same like, 'My favorite top 10 Features of SQL 2008 R2' However, it is also important to know which features are not supported anymore. In the upgrade from SQL 2008 to SQL 2008 R2 most changes are done in the BI stack. The database engine is not changed so much. You can see this when you look to the available database compatibility levels. For SQL 2008 R2, there is no new database compatibility level introduced. After your upgrade to SQL 2008 R2 your database will still stay on compatibility level 100 (SQL2008)


Here you can find a full list of all deprecated database engine features in SQL 2008 R2

Thursday, May 6, 2010

Tips to improve performance of MS Reporting service reports (SSRS).

Photo credit: visuloqik
A lot of times I got questions from people how to improve SSRS reports. Of course every report is different, but some tips can be applied to every report. Assume we have a report which takes X seconds to display all data on your screen. The total time to generate a SSRS reports can be split into 2 main parts:

  1. Time to executed all queries on the SQL Server. Use the SQL profiler to measure the duration of all executed queries. (Y seconds)
  2. Time to generated the report on the reporting server, based on the result set of the executed queries. (Z seconds)
Because we know the total time to execute the report and the total duration of all executed queries, you can calculate the time to generate the report (Z seconds). (X = Y + Z). After you know the values for X, Y and Z, you can start focusing on the biggest part.

  • Use the SQL Profiler to see which queries are executed when the report is generated. Sometimes you will see more queries being executed than you expected. Every dataset in the report will be executed. A lot of times new datasets are added during building of reports. Check if all datasets are still being used. For instance, datasets for available parameter values. Remove all datasets which are not used anymore.
  • A dataset contains more columns than used in the Tablix\list. A lot of times you will see datasets with next syntax:

    SELECT * FROM TableX WHERE Column1 = 'Something'.

    This is easy when start building the report. It will retrieve all columns of the table. However all columns are not useful and creates a lot of overhead. Assume you uses 3 columns in the tablix\list. Change the syntax of the dataset to only these 3 columns. This can save bookmark lookups and it will save disk I/O on the SQL Server. So you get a dataset with next syntax:

    SELECT Column1, Column5, Column 8 FROM TableX WHERE Column1 = 'Something'
  • ORDER BY in the dataset differs from the ORDER BY in the Tablix\list. You need to decide where the data will be sorted. It can be done within SQL Server with an ORDER BY clause in the dataset or in by the Reporting server engine. It is not useful to do it on both sites. If an index is available use the ORDER BY in your dataset.
  • Use the SQL Profiler to measure the performance of all datasets (Reads, CPU and Duration). Use the SQL Server Management Studio (SSMS) to analyze the execution plan of every dataset.
  • Avoid datasets with result sets with a lot of records like more than 250 records. Greater result sets are more like a data export (dump). A lot of times data is GROUPED in the report without an Drill down option. In that scenario do the group by already in your dataset. This will save a lot of data transfer to the SQL Server and it will save the reporting server engine to group the resultset.
  • Rendering of the report can take a while if the resultset is very big. Look very critical if such a big resultset is necessary. If details are used in only 5 % of the situations, create another report to display the details. This will avoid the retrieval of all details in 95 % of the situations.
  • Use the database documentation of your applications to understand how to retrieve information from the database. For Exact Globe click here to find the database documentation. For Exact Synergy Enterprise click here to find the database documentattion.
Enjoy building high performing reports.

Monday, May 3, 2010

What is Optimize for ad hoc workloads option in SQL 2008 and how to configure


The optimize for ad hoc workloads option can improve the overall performance of your SQL Server. This option is introduced in SQL 2008 to improve the efficiency of the plan cache. At the moment a query is started SQL Server will first analyze the query to find the best way to execute the query. This is called the execution plan. In the execution plan information is stored about for instance which index to use to retrieve the data. All execution plans are stored in the plan cache. If a new query is executed, SQL server will look if an execution plan is available for this query in the plan cache. If it is available it will be re-used. This will save the generation of the execution plan. For every execution plan SQL server counts how much time it is used.
With next query you can see the content of the plan cache.

SELECT TOP 50 usecounts, cacheobjtype, objtype, TEXT, CAST(size_in_bytes AS BIGINT)/1024 as Size_in_Kb
FROM sys.dm_exec_cached_plans
CROSS APPLY sys.dm_exec_sql_text(plan_handle)

What you will see is a lot of queries which are executed ones. (Column Usecount = 1). With next query you can retrieve the number of queries and the size in the plan cache which are executed ones:

SELECT COUNT(*), SUM(CAST(size_in_bytes AS BIGINT))/1024 AS Size_in_Kb
FROM sys.dm_exec_cached_plans
CROSS APPLY sys.dm_exec_sql_text(plan_handle)
WHERE usecounts = 1

You will see a big number of queries which are executed ones. Now compare these values with the queries which are executed more than ones.

SELECT COUNT(*), SUM(CAST(size_in_bytes AS BIGINT))/1024 AS Size_in_Kb
FROM sys.dm_exec_cached_plans
CROSS APPLY sys.dm_exec_sql_text(plan_handle)
WHERE usecounts > 1

Because a lot of queries are executed ones it is not so useful to store the full execution plan in the plan cache. The optimize for ad hoc workloads will store a small compiled plan stub in the plan cache when a query is compiled for the first time, instead of the full compiled plan. The compiled plan stub allows the Database Engine to recognize that this ad hoc query has been compiled before but has only stored a compiled plan stub, so when this query is invoked (compiled or executed) again, the Database Engine compiles the query, removes the compiled plan stub from the plan cache, and adds the full compiled plan to the plan cache. One stub plan takes about 0.25 Kb. A full compiled plan is much bigger. For complex queries is can be more than 100 Kb. This is a factor 400 bigger.
Run next query to get an overview of the different cache objects in the plan cache.

SELECT objtype, cacheobjtype,COUNT(*) AS Number_of_plans, SUM(CAST(size_in_bytes AS BIGINT))/1024/1024 AS size_in_MBs,AVG(usecounts) AS avg_use_count, (SUM(CAST(size_in_bytes AS BIGINT))/1024)/COUNT(*) AS average_size
FROM Sys.dm_exec_cached_plans
GROUP BY Objtype, cacheobjtype
ORDER BY Objtype, cacheobjtype

Save the result set of this query. Now we have the plan cache statistics of your server. Now it's time to enable the optimize for ad hoc workloads option. Enable the  optimize for ad hoc workloads option with next query:

'show advanced options',1
RECONFIGURE
GO
SP_CONFIGURE 'optimize for ad hoc workloads',1
RECONFIGURE
GO

Re run the query to get an overview of the different cache objects in the plan cache after a while. Now you will see the number of Compiled plans will be much lower becaues these will only containts queries which are executed more than ones.  The number of Compiled Plan Stub will still be high, however the average size is very small.
Photo credit: HIRATA Yasuyuki