Showing posts with label performance. Show all posts

Friday, May 24, 2013

How to retrieve IO statistics of SQL databases on file level?


Performance of a SQL database depends on different factors. One of these factors is disk activity, also known as Disk IO. With Windows Performance monitor (Perfmon) you can measure the performance of your disk. However if you have 4 database files on 1 drive, you do not know which of your databases is causing the most Disk IO. Within SQL Server you can use a dynamic view which will give you information on database file level.  Execute next statement on the SQL Server:

SELECT d.name  ,s.filename, NumberReads,  NumberWrites,  BytesRead,BytesWritten,
 IoStallReadMS, IoStallWriteMS, IoStallMS,BytesOnDisk
FROM Fn_Virtualfilestats(NULL,NULL) f
INNER JOIN sys.sysaltfiles s ON f.dbid = s.dbid and f.FileId = s.fileid
INNER JOIN sys.databases d ON f.DbId = d.database_id
ORDER BY IoStallReadMS DESC

This query will show next columns:

Name: Database name
Filename: Filename of the database file. Look to the extension to see if it is the MDF or LDF file
Timestamp: Database timestamp at which time the data was taken
Number of reads: Number of reads issued on the file
BytesRead: Number of bytes read issued on the file
IoStallReadMS: Total amount of time, in milliseconds, that users waited for the read IOs to complete the file
Number of writes: Number of writes issued on the file
BytesWritten: Number of bytes written issued on the file
IoStallWriteMS: Total amount of time, in milliseconds, that users waited for the read IOs to complete the file
BytesOnDisk: Physical file size(count of bytes) on disk.


With this query, you can look which databases are generating the most IO and time database files are waiting on the disk to get the required data. This can help you to decide to move some database files to seperate disks.

Thursday, February 28, 2013

Performance tips for your Power Pivot sheet


Power Pivot is a really good personal Business Intelligence tool with a great performance. However, for every tool there are tips to optimize the performance. In Power Pivot you need to define the BISM. (Business Intelligence Semantic model), please take next tips into consideration during the design of your BISM model:

  • Use views to import data in Power Pivot. The view will contain the business logic of how the data is stored in your database. If changes are made to your business logic, you only need to change the views. The Power Pivot sheet will still work.
  • Use logical columns names in the views. For instance [Account code] in stead of debnr. Everybody should understand what kind of content is stored in each column.
  • Import only columns you really need. Avoid SELECT * FROM MyView1 As described in my previous blog post: Memory management in Power Pivot, all data is kept in memory. Every column which is not used will use memory which can not be used for other purposes.
  • Import columns which are useful for analytics purposes. For instance for customer data: Account code, Country, State. Columns like street name are not so useful. As described here, it will create a lot of distinct values in your dictionary for this column. This will have a negative impact on performance.
  • Import DateTime columns in 2 separate columns. One Date column and one Time column. If time portion is not useful for your analytics do not import it at all.
  • Import master data in separate tabs. For instance all item attributes in one tab and use the item key in all transactional tabs. Link the item key from the transactional tab to the item key of the Item master tab.
  • Reduce the number of rows to import. If you analyse on month level, group all data in the view to the level you want. For instance group by Date, Item, Amount. This will save a lot of rows to import. Of course, this is not possible sometimes because you do not want to loose the granularity of analysis.
  • Reduce the number of rows to import by selecting only the subset you are going the analyze. For instance your database contains financial transaction as of financial year 2008. If you need to analyze of the current and previous year, import only the last 2 years.
  • Optimize column data types. A column with few distinct values will be lighter than a column with a high number of distinct values. This is important also for measures, which are considered also possible quantitative attributes. If the measure you are storing is a float and is the result of a calculation, consider reducing the number of digits to be imported. This will reduce the size of the dictionary, and possibly also the number of distinct values.
  • Avoid high-cardinality columns. Columns with unique ID's like invoice numbers are very expensive. Sometimes you can skip this columns and use the COUNTROWS function instead of the DISTINCTCOUNT.
  • Use measures instead of calculated columns if possible. Calculated columns are stored as an imported column. This does not apply to calculated measures. A calculated measure is calculated at query time.
  • In case you need to store a measure in a calculated column, consider to reduce the number of digits of the calculation.
  • Normalizing data doesn’t have a big effect on the size of the resulting database. However, it might have a strong impact on both processing time and memory required to process data. The key is to find a right balance. A Star schema is in most situation the right balance.
Enjoy it, to make your Power Pivot sheets even more powerful.

Wednesday, February 27, 2013

Memory management in Power Pivot: Column oriented databases.


Power Pivot is a perfect personal Business Intelligence tool. It is simple to use and the performance of the Power Pivot engine is really great. To better understand this engine, so you can even better make use of it, I will explain how this engine is working.

Row oriented versus column oriented databases.

All traditional relational databases, including SQL Server, are row oriented databases. They store data in tables row by row. The row of a table is the main unit of storage. Indexes are used to point to all columns of a certain row. It depends on the definition of the index which records belongs to this index.

A column-oriented database, like Power Pivot, uses a different approach. Every column is considered as a separate entity. Data is stored for every column in a separate way. I will explain this with an example.
 
ID
Car
Engine
Color
1 Audi A4 Petrol Silver
2 Audi A4 Gazole Red
3 Audi A4 Gazole Blue
4 BMW Petrol Silver
5 BMW Gazole Silver
6 BMW Gazole Red
7 Mercedes Gazole Blue

 Every column will have it's own sorted dictionary with all distinct values and a bitmap index references the actual values of each item in the column by using a zero-based index to the dictionary. Next table will show the dictionary values and index values.
 
Column
Dictionary
Values
ID
32,23,10,43,57,65,71
2,1,0,3,4,5,6
Car
Audi,BMW,Mercedes
0,0,0,1,1,1,2
Engine
Petrol, Gazole
0,1,1,0,1,1,1
Color
Silver, Red, Blue
0,1,2,0,0,1,2

As you can see, the dictionary can be the most expansive part of the index. Especially if a high number of distinct values exists in a column. The lower the number of distinct values in a column the smaller the size of dictionary for this column. This will make the value bitmap index more efficient.

The xVelocity engine, which is implemented on Power Pivot, is an in-memory database. This means that it has been designed and optimized assuming that the whole database is loaded in memory. Data is compressed in memory and dynamically uncompressed during each query. Because all data is kept in memory it is essential to be critical which data to import in your Power Pivot sheet. For instance customer data can be useful like, country, state. However street name is not efficient. Every customer will have a unique address which will result in a big dictionary without a low number of distinct values. It will have a high number of distinct values.

Enjoy the power of Power Pivot.

Tuesday, January 31, 2012

Analyze performance between SQL Azure and SQL Server on premise.

You need to be convinced that the performance in SQL Azure is acceptable for your end users before you can move you ron premise databases to SQL Azure. In the on-premise environment you have a lot of tools which you can use to measure the SQL performance of your application. However, in SQL Azure the tools are not so good as the on–premise versions. For instance:
  • You can’t connect with SQL Profiler to a SQL Azure database.
  • You can’t connect with Windows performance monitor (Perfmon) from an Azure worker role to your SQL Azure database server.
I strongly hope that this will be improved by Microsoft in the future. In this blog I will describe what you can do to analyze performance of your application in SQL Azure. Most of the methods requires a lot of manual work, but it is better than nothing.
 
First of all you need to upload a version of your on premise database to SQL Azure. Use the SQL Azure Migration Wizard. The SQL Azure Migration Wizard is an open source application, which is designed to help you to migrate your SQL Server 2005/2008/2008R2/2012 databases to SQL Azure.  SQL Azure Migration Wizard will analyze your source database for compatibility issues and allow you to fully or partially migrate your database schema and data to SQL Azure.  SQL Azure Migration Wizard requires SQL 2008 R2 SP1.
 
 
After uploading your database to SQL Azure we can start comparing query performance between the on-premise database and the SQL Azure database. Take into account that latency between your test load application and the SQL Azure database should be minimized. This can be done in 2 ways:
  • Use queries for which the result set is minimal. For instance  SELECT COUNT(*) FROM TABLEX will result in one number. This is a minimum number of bytes to transfer to the client. SELECT * FROM TABLEY will result in a lot of data transfer from SQL Azure server to the client.
  • Execute queries from a Azure worker role which is hosted in the same data center as your SQL Azure server.
Record with SQL profiler some queries from your on premise solution. Store these queries in a SQL script file. In this SQL script file add next command before every query.
 
PRINT 'Query: Cashflow entries to be allocated 1'
SET STATISTICS IO ON
SET STATISTICS TIME  ON

SELECT Columns FROM MYtable

Add next command after every query:
SET STATISTICS IO OFF
SET STATISTICS TIME OFF
PRINT
'----------------------------------------------------------------------'

The SQL Script will be executed in SQL Server Management Studio (SSMS) . Enable Include Client Statistics. (Shift-ALT-S)


Result of the query is printed on the Results tab in SSMS


The IO and Time statistics are printed on the message tab in SSMS

SET STATISTICS IO ON: Will generate  ‘SQL Profiler’ read statistics per query.
SET STATISTICS TIME ON: Will generate ‘SQL Profiler’ CPU Time and total elapsed query time.
The client statistics are printed on the Client Statistics tab.

To measure the total of all queries in one script add next command to the script.
DECLARE @STARTTIME DateTimeDECLARE @ENDTIME DateTime
SET @STARTTIME = GETDATE()
Query 1
Query 2
….
Query X
At the bottom of the script add next syntax

SET @ENDTIME = GETDATE()
SELECT GETDATE(),DATEDIFF (ms, @STARTTIME, @ENDTIME) AS QueryTime

After executing the script the last result set in the Results tab will display the execution time and exection time of the total script.


Now your script is READY for testing. Execute the script on:
  1. The on premise database
  2. SQL Azure database
Compare the results between the on premise results and the SQL Azure results.

In the Management Portal for SQL Azure you can get an overview of the query performance.

Thinks to take into account:
  • Use only SELECT queries which enables you to redo test a lot of times on the SQL Azure database without the need to restore the database.
  • If you plan to use INSERT, DELETE and UPDATE statements, you need to have a backup of your SQL Azure database.  Backup and Restore is not supported in SQL Azure at this moment but you can use the CREATE DATABASE  XXX AS COPY of YYY statement. This will create a copy of your database using a new database name.

    CREATE DATABASE destination_database_name
    AS COPY OF [source_server_name.]source_database_name

    To copy the Adventure Works database to the same server, I execute this:
    CREATE DATABASE [AdvetureWorksBackup]
    AS COPY OF [AdventureWorksLTAZ2008R2]
Observations:
  • SQL Azure execute queries using one processor  (MAXDOP 1). Parallelism is not possible. 
  • Dynamic Views in the manage portal contain history for a small period.  It’s difficult to see long running queries for a longer period. This happens because you will be connected to one of the 3 copies of your database.  You never know to which of the copies you will be directed. Every copy will have it’s own content in the DMV’s .
  • Performance is not guaranteed on SQL Azure.
  • In the tests I have executed so far, the SQL Azure database (8 GB Business Edition) is significant slower in comparison with a SQL database on my laptop. (DELL Latitude E6410).  One of the reasons is the single processor usage of SQL Azure. 

Tuesday, December 13, 2011

Overview performance articles on my blog


Over the last years I have blogged about a lot of topics related to the performance of SQL Server and SQL Reporting services. In this blog I will give an overview of the different articles I have published in the last 2 years.

SQL Server:
Monitoring
Index management

Other

Reporting Services:

SQL Azure

SQL Azure Reporting:

Monday, November 28, 2011

Executionlog of SQL Azure Reporting reports .


In one of my previous blogs I wrote about performance tips to improve the performance of your SSRS reports. In this blog I wrote about the 3 different performance elements during the execution of a report:
  1. Time to retrieve the data (TimeDataRetrieval).
  2. Time to process the report (TimeProcessing)
  3. Time to render the report (TimeRendering)
Total time = (TimeDataRetrieval) + (TimeProcessing) + (TimeRendering)

As of SQL Server 2008 R2, this 3 performance components are logged every time for which a deployed report is executed. This information can be found in the table Executionlog3 in the ReportServer database. In SQL Azure Reporting you can't access the ExectionLog3 table, however it is still possible to get the contents of this table. To get the contents of this table do the following:

  1. Login to the Azure Management Portal.
  2. Select Reporting
  3. Select your reporting subscription.
  4. Press the Download Execution Log button in the top of the management portal.
  5. Select the date you want to export.
  6. Open the downloaded CSV file in Excel.

Tuesday, August 23, 2011

Thanks to all 5000 customers who have used the Exact System Information tool


In februari 2010 we introduced the Exact System Information (ESI) tool, which can generate an Improvement Report for you Exact solution. Last week we  reached a new milestone.

5000 customers, from all over the world,
have used the ESI tool.
2800 Improvement reports have been generated.

I want to thank all customers for using the ESI tool. Beside the fact that we will help you to optimize your Exact solution, it will help Exact to better understand how our customers are using the Exact solution.

Additional information about the Exact System Information tool:

Tuesday, June 21, 2011

Troubleshooting and optimizing queries on SQL Azure.

In one of my previous blogs I wrote about some usefull DMV's to analyze SQL Azure performance.  SQL Azure is a cloud based relational database with SQL Server 2008 engine at its core. In the first release of SQL Azure most useful DMVs have been disabled. As part of the scheduled Service Updates (SUs) to SQL Azure, these DMVs are enabled in phases. Since SQL Azure is a shared infrastructure model, the DMVs have to be modified to filter the output and show information only as appropriate. In this effort, the following DMVs have been enabled in the first phase. These DMVs being released typically require VIEW SERVER STATE permissions in an on-premise SQL Server. The new permission level required on SQL Azure would be VIEW DATABASE STATE to query these DMVs.

Transaction related DMVs
  • sys.dm_tran_active_transactions - returns information about transactions for the SQL Azure server 
  • sys.dm_tran_database_transactions - returns information about transactions at the user database level 
  • sys.dm_tran_locks - returns information about currently active lock manager resources. Each row represents a currently active request to the lock manager for a lock that has been granted or is waiting to be granted. The columns in the result set are divided into two main groups: resource and request. The resource group describes the resource on which the lock request is being made, and the request group describes the lock request. 
  • sys.dm_tran_session_transactions - returns correlation information for associated transactions and sessions.
Execution related DMVs
  • sys.dm_exec_connections - returns information about the connections established to SQL Azure and the details of each connection. 
  • sys.dm_exec_query_plan - returns the showplan in XML format for the batch specified by the plan handle. The plan specified by the plan handle can either be cached or currently executing. 
  • sys.dm_exec_query_stats - returns aggregate performance statistics for cached query plans. The view contains one row per query statement within the cached plan, and the lifetime of the rows are tied to the plan itself. When a plan is removed from the cache, the corresponding rows are eliminated from this view. 
  • sys.dm_exec_requests - returns information about each request that is executing within SQL Azure. 
  • sys.dm_exec_sessions - returns one row per authenticated session on SQL Azure.
  • sys.dm_exec_sql_text - Returns the text of the SQL batch that is identified by the specified sql_handle. This table-valued function replaces the system function fn_get_sql.
  • sys.dm_exec_text_query_plan - returns the showplan in text format for a Transact-SQL batch or for a specific statement within the batch. The query plan specified by the plan handle can either be cached or currently executing. This table-valued function is similar to sys.dm_exec_query_plan (Transact-SQL), but has the following differences:  1) The output of the query plan is returned in text format. 2) The output of the query plan is not limited in size.

Database related DMVs
  • sys.dm_db_partition_stats - returns page and row-count information for every partition in the current database.

As you can see, the number of DMVs is growing but unfortunaltely still no SQL Azure Profiler available. At this moment I got 204 votes for my idea for a SQL Azure Profiler on mygreatwindowsazureidea.com. So let's hope that a SQL Azure Profiler will come available in one of the coming Service Updates (SUs).

Enjoy it!

Friday, June 17, 2011

Whitepaper: Analysis Services Operatings Guide (SSAS)


Microsoft has published the whitepaper: Analysis Services Operatings Guide. In this guide you will find information on how to test and run Microsoft SQL Server Analysis Services in SQL Server 2005, SQL Server 2008, and SQL Server 2008 R2 in a production environment. The focus of this guide is how you can test, monitor, diagnose, and remove production issues on even the largest scaled cubes. This paper also provides guidance on how to configure the server for best possible performance. It is the goal of this guide to make your operations processes as painless as possible, and to have you run with the best possible performance without any additional development effort to your deployed cubes. In this guide, you will learn how to get the best out of your existing data model by making changes transparent to the data model and by making configuration changes that improve the user experience of the cube.However, no amount of operational readiness can cure a poorly designed cube. Although this guide shows you where you can make changes transparent to end users, it is important to be aware that there are cases where design change is the only viable path to good performance and reliability. Cubes do not take away the ubiquitous need for informed data modeling. Fortunately, this operations guide has a companion volume targeted at developers: the Analysis Services Performance Guide. We highly recommend that your developers read that white paper and follow the guidance in it.

Enjoy reading the whitepaper Analysis Services Operatings Guide. To directly download the whitepaper from the Microsoft Download Center click here.

Monday, May 16, 2011

Usefull DMV's for SQL Azure to analyze if you miss SQL Profiler.

I have started a research project to look to the current possibilities of SQL Azure Reporting Services. One of the key areas I will focus on is the performance of SQL Azure Reporting services. To use SQL Azure Reporting Services you need to create a SQL Azure database and upload content to it. This can be done by making use of the Import and Export wizard.  After that I created my first SQL Azure Reporting Server report in SQL Server Business Intelligence Development Studio (BIDS) and deployed it to my SQL Azure Reporting server. To run the report, it took a 5 seconds to show the results. I was a little bit suprised why this report took 5 seconds to generate. Normally I use the SQL Profiler to analyze this performance issue. However, SQL Profiler is not available for SQL Azure. It is still a feature request on  mygreatWindowsAzureidea.com
with already 96 supporters for this idea.

Up till now, we need to do it with the available DMV's. More and more DMV's will come available in future releases. In this blogpost I will share some usefull queries on these DMV's which you can use to analyze the performance of your application on a SQL Azure database. In my situation the Azure Reporting Server.

Of course these queries can't replace the powerfull features of SQL Profiler, but at least it will help you and it is better than nothing.

--1)  Last executed queries with used query plan.

SELECT TOP 5 query_plan,q2.[text],
  (total_logical_reads/execution_count) AS avg_logical_reads,
  (total_logical_writes/execution_count) AS avg_logical_writes,
  (total_physical_reads/execution_count) AS avg_phys_reads,
  execution_count,
  (total_elapsed_time/execution_count) AS avg_Duration,
  last_execution_time
FROM sys.dm_exec_query_stats qs
CROSS APPLY sys.dm_exec_query_plan(qs.plan_handle)
CROSS APPLY sys.dm_exec_sql_text(Sql_handle) AS q2
ORDER BY last_execution_time DESC

In the column Query_Plan you can click on the hyperlink.


This will show the query plan which was used during Query execution.


-- 2) Running queries.
SELECT q2.[text],database_id, user_id,session_id,
  transaction_id,status,start_time
FROM sys.dm_exec_requests
CROSS APPLY sys.dm_exec_sql_text(Sql_handle) AS q2

-- 3) Blocking queries
SELECT q2.[text],session_id, blocking_Session_id,database_id, user_id,transaction_id
FROM sys.dm_exec_requests
CROSS APPLY sys.dm_exec_sql_text(Sql_handle) AS q2
WHERE blocking_session_id <> 0 AND Blocking_Session_ID <> Session_ID

-- 4) Queries generating the most IO in SQL Azure.
SELECT TOP 5 query_plan,q2.[text],
  (total_logical_reads/execution_count) AS avg_logical_reads,
  (total_logical_writes/execution_count) AS avg_logical_writes,
  (total_physical_reads/execution_count) AS avg_phys_reads, execution_count,
  (total_elapsed_time/execution_count) AS avg_Duration,
last_execution_time
FROM sys.dm_exec_query_stats qs
CROSS APPLY sys.dm_exec_query_plan(qs.plan_handle)
CROSS APPLY sys.dm_exec_sql_text(Sql_handle) AS q2
ORDER BY total_logical_reads DESC

-- 5) Enable Client Statistics in SSMS
By enabling Client Statistics in SSMS you can see the number of Bytes received from the server, the total execution time, Wait time on server replies.


Enjoy, using these DMV's till a good replacement is available for SQL Profiler on a SQL Azure database.

Monday, April 4, 2011

Part 2: Analyze SQL Profile traces with SSRS dashboard. How does it work?

As described in my previous blogpost I started a series in which I will explain how you can make a dashboard in SQL Reporting Services to analyze your SQL Server Profiler trace files. In this blogpost I will explain what you need to install and configure to use this dashboard.

What do you need to install:
  • SQL Server 2008 R2 database engine. This database server is used to import all trace files into a database.
  • SQL Server Reporting Services. (2008 R2). This reporting server is used to host the dashboard.
  • SQL Server Business Intelligence Development Studio. With BIDS you can modify the dashboard and deploy the reports to the reporting server.
What else do you need:
  • Use the default trace file template of SQL Profiler to trace your application. Be aware to use the correct filter for the trace, so you got only these queries you want to analyze. For instance you can filter on hostname, spid or applicationname.
  • Script to create database and table in which all trace files are imported.
  • Import script to import the SQL Profiler trace files (.TRC)
  • The SSRS reports of the dashboard to analyze the trace files.
First we will start to create a new PerformanceAnalyze database and import table: TraceFileImport

-- BEGIN Performance analyze script created by André van de Graaf
-- Blog site http://www.keepitsimpleandfast.com/

USE MASTER
GO

-- Create PerformanceAnalyze database
CREATE DATABASE [PerformanceAnalyze] ON PRIMARY
(NAME = N'PerformanceAnalyze',
FILENAME = N'D:\Data\PerformanceAnalyze.mdf',
SIZE = 102400KB , FILEGROWTH = 10%)
LOG ON
(NAME = N'PerformanceAnalyze_log',
FILENAME = N'D:\Data\PerformanceAnalyze_log.ldf',
SIZE = 10240KB , FILEGROWTH = 10%)

GO

USE [PerformanceAnalyze]
GO

-- Create table in which all trace files will be uploaded.
CREATE TABLE [dbo].[TraceFileImport](
[RowNumber] [int] IDENTITY(0,1) NOT NULL,
[EventClass] [int] NULL,
[TextData] [ntext] NULL,
[ApplicationName] [nvarchar](128) NULL,
[NTUserName] [nvarchar](128) NULL,
[LoginName] [nvarchar](128) NULL,
[CPU] [int] NULL,
[Reads] [bigint] NULL,
[Writes] [bigint] NULL,
[Duration] [bigint] NULL,
[ClientProcessID] [int] NULL,
[SPID] [int] NULL,
[StartTime] [datetime] NULL,
[EndTime] [datetime] NULL,
[BinaryData] [image] NULL,
[ImportID] [nvarchar](50) NULL,

PRIMARY KEY CLUSTERED
([RowNumber] ASC)
WITH (PAD_INDEX = OFF,
STATISTICS_NORECOMPUTE = OFF,
IGNORE_DUP_KEY = OFF, ALLOW_ROW_LOCKS = ON,
ALLOW_PAGE_LOCKS = ON) ON [PRIMARY]
) ON [PRIMARY] TEXTIMAGE_ON [PRIMARY]

-- END Performance analyze script created by André van de Graaf


Now we have the database and import table, so we are ready to import the first trace files. The trace files will be imported by the stored procedure: PA_ImportTraceFile.

-- Create stored procedure to import the trace files
SET ANSI_NULLS ON
GO
SET QUOTED_IDENTIFIER ON
GO
CREATE PROCEDURE [dbo].[PA_ImportTraceFile]
(@ImportID nvarchar(50), @TraceFile NVARCHAR(2000)) AS
INSERT INTO TraceFileImport
SELECT eventclass,TextData,ApplicationName,NTUserName,
LoginName,CPU,Reads,Writes, Duration, ClientProcessID,
SPID,StartTime,EndTime,BinaryData,@ImportID AS importid
FROM :: fn_trace_gettable(@TraceFile,default )
GO

This stored procedure uses 2 parameters: Importid,Tracefilename_and_location
The ImportID is used in the SSRS reports to select your trace file.


Example:
EXEC PA_ImportTraceFile 'CustomerX_1','D:\Traces\Cust_Trace1.trc'

In my next blogpost I will make the SSRS reports available and will explain what you need to configure at the reporting server to use these reports. So stay tuned for the SSRS reports.

Previous posts in this series:
Part 1 Analyze SQL Profile traces with SSRS dashboard.

Thursday, December 16, 2010

What triggers the update of statistics in my SQL 2008 database, when are the statistics out of date ?


Microsoft SQL Server 2008 collects statistical information about indexes and column data stored in the database. These statistics are used by the SQL Server query optimizer to choose the most efficient plan for retrieving or updating data. By default, SQL Server 2008 also creates and updates statistics automatically, when such an operation is considered to be useful. Sometimes it can happen that your statistics are not representative for your current data distribution which can result in a not efficient query plan. SQL Server 2008 determines whether to update statistics based on changes to column modification counters (colmodctrs).


If the statistics is defined on a regular table, it is out of date if:
  • The table size has gone from 0 to >0 rows.
  • The number of rows in the table when the statistics were gathered was 500 or less, and the colmodctr of the leading column of the statistics object has changed by more than 500 since then.
  • The table had more than 500 rows when the statistics were gathered, and the colmodctr of the leading column of the statistics object has changed by more than 500 + 20% of the number of rows in the table when the statistics were gathered.
  • For filtered statistics, the colmodctr is first adjusted by the selectivity of the filter before these conditions are tested. For example, for filtered statistics with predicate selecting 50% of the rows, the colmodctr is multiplied by 0.5.
One limitation of the automatic update logic is that it tracks changes to columns in the statistics, but not changes to columns in the predicate. If there are many changes to the columns used in predicates of filtered statistics, consider using manual updates to keep up with the changes.

More detailed information about database statistics can be found in this whitepaper: Statistics used by the query optimizer in Microsoft SQL Server 2008.

Thursday, October 21, 2010

Exact System Information improvement report extended with filtered index suggestions.

As of today the Exact System Information improvement report is extended with the possibility to implement filtered indexes for Globe databases on a server with SQL Server 2008 or SQL 2008 R2. See next screen shot from an improvement report.


As of SQL Server 2008 filtered indexes are introduced. A filtered index allows us to create an index with a filter on a subset of rows within a table. A filtered index will:
  1. Improve query performance. Statistics are more accurate which can result in better query plans.
  2. Reduce index maintenance costs. An index is only maintained when the data in the index is changed.
  3. Reduce index storage costs.
Filtered indexes can be very useful on columns which contains mostly NULL values and where the queries retreive only the rows where the data is NOT NULL. In Exact Globe we have a lot of indexes on columns which contains mostly NULL values. See Microsoft website link for more information about filtered indexes.

After implementing filtered indexes on some customer databases, we have seen reduction of the index size between 25% to 30%. This will results in an overall database size reduction of around 10 %. The actual reduction of the index size in your database depends on the number of NULL values in your database. Please DO NOT shrink your database after implementing the filtered indexes. Shrinking databases and explanding database can result in defragmentation of the database files on NTFS level. SQL Server will first use the free space in the database before it will growth.

Performance tests indicated no noticeable performance increase or decrease with read actions, however write performance is gained due to the fact less index information needs to be written. After implementing filtered indexes, the fragmentation of your indexes will be lower. This is good for the overall performance of your Exact solution.

To begin you need to start the Exact System Information tool and request an improvement report. The user who start the Exact System Information tool should have a SQL System Administrator role (SA). If you can implement filtered indexes, it will be mentioned in the improvement report. In the improvement report you will find a link to the script to implement filtered indexes.

We strongly advise you to run the Exact System Information on a regular basis. For instance once per 3 months. We are adding on a regular basis new suggestions to the improvement report to improve your Exact solution. If you have any feedback, please let us know. You can comment on this blog post or send an email to Andre@exact.com

This blog is also published on the Exact Product Blog.

Wednesday, October 6, 2010

Combine SQL Profiler with Performance monitor logs

To analyze the performance of your applications which is running on SQL Server you need to make use of 2 standard tools:
  1. SQL Profiler
  2. Windows Performance Monitor. (Perfmon)
Both tools are useful to understand what happens at which moment. In SQL Profiler you load a profile trace however you can also load the performance monitor log file in the same loaded SQL Profiler trace file. See next example:


What do you need to do:
  1. Make a SQL Profile trace of your application.
  2. Make a performance log file with Performance monitor (Perfmon) of your application via a data collector set. Save the result to a file.
  3. Execute some load in your application.
  4. Stop the SQL profiler trace file and store it as a trace file.
  5. Load the trace file in SQL Profiler.
  6. In the menu of SQL Profiler Select File, Import Performance Data and select your performance log file.
  7. Select the counters you want to see in the SQL profiler.
Now you have both trace files combined in one application. When you scroll through the profile entries you will see the red vertical bar moving. A perfect way to analyze the performance of your application.

Enjoy using the performance monitor with SQL Profiler.

Thursday, August 26, 2010

Use SQL profiler replay traces to benchmark performance of your SQL server database.


In SQL Server 2008 (R2) a lot of new features are build to improve the overall performance of your database. These features are mostly independent of your application. To implement these new features, you want to know what the impact is of an implemented feature. This blogpost will explain how SQL Profiler can help you to simulate 'production' workload on your database.
Some examples of these new features:
The biggest challenge in simulating workload is to get a workload which is comparable to the workload in the production environment. This is possible with SQL Profiler. With SQL profiler you can capture the workload on your production database. This capture can be used as workload on a copy of your production database.

In general the replay process can divided into:

  1. Make a full backup of the production database.
  2. Capture workload with SQL Profiler.
  3. Restore production database on a test server.
  4. Replay workload to create baseline. Use SQL profiler to measure CPU and IO
  5. Restore production database and configure some of the new features.
  6. Replay workload. Use SQL Profiler to measure CPU and IO.
  7. Compare the results with the baseline.

Step 1: Make a full backup of your production database.

Step 2: Capture workload with SQL profiler
  1. Start SQL Profiler with the trace template 'TSQL_Replay' and a filter on the database id of your production database.
  2. Save the trace results to a new database on another SQL server as your production server.


  3. Select a database in which you want to store your replytraces and define a table name. In this example I have created a Database: ReplayTraces.

     
  4. Define a filter for the database of your production database. Use next query to retrieve the database ID of your production database:
    SELECT Dbid FROM Master..SYSDatabases WHERE Name = ''
  5. Start the profiler when the FULL BACKUP process is almost completed. Starting the replay just before the full backup is completed garantees that you have all queries which are executed after the full backup is completed.
  6. The profiler will now capture all executed queries on your production database.
  7. Stop the SQL Profiler trace at the moment you have captured enough data which can be representative for your tests.
Step 3: Restore production database on a test server.

Now we have a backup of the production database and a database with the captured workload. Be sure to have backups of these 2 database because you will need them a lot of times for your tests.
Restore the backup of your production database on your test server.


Step 4: Replay workload to create baseline. Use SQL profiler to measure CPU and IO

For a benchmark we need to have a baseline. To create a baseline execute next steps:
  1. Load the captured profile data in the SQL Profiler.
  2. Open SQL profiler and select File, Open, Trace Table.
  3. Select the SQL Server,Database and tablename in which you have captured the production workload.
SQL Profiler Replay Requirements:
To replay a trace against a server (the target) on which SQL Server is running other than the server originally traced (the source), make sure the following has been done:

  • All logins and users contained in the trace must be created already on the target and in the same database as the source.
  • All logins and users in the target must have the same permissions they had in the source.
  • All login passwords must be the same as those of the user that executes the replay.
  • The database IDs on the target should be the same as those on the source. If they are not the same you can do the following: Assume Source DBID = 10 Target DBID = 6. Detach your TestProduction database. Create a new database. This database will get DBID 6. Create 3 other Databases. The last created database will have DBID 9. Attach you TestProduction database. This will now get DBID 10.
  • The default database for each login contained in the trace must be set (on the target) to the respective target database of the login. For example, the trace to be replayed contains activity for the login, Fred, in the database Fred_Db on the source. Therefore, on the target, the default database for the login, Fred, must be set to the database that matches Fred_Db (even if the database name is different). To set the default database of the login, use the sp_defaultdb system stored procedure.
More information about replay requirements can be found here

  1. Create and start a SQL profile trace with a filter on the database ID of the restored production database on the test server. Save the results to a SQL Server database. This will be your baseline.
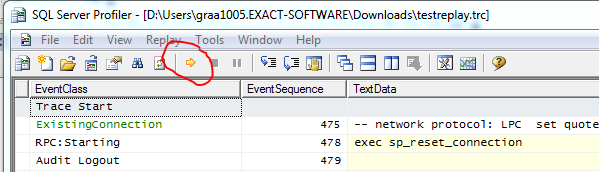
  2. To start the Replay, press the yellow arrow.

Step 5: Restore production database and configure some of the new features.
In the previous step we made the baseline. Now it is time to test the new features.
  1. Configure the new features you want to test.
  2. Load the captured profile data in the SQL Profiler
  3. Create and start a SQL profile trace with a filter on the database ID of the restored production database on the test server. Save the results to a SQL Server database in another table as you used for your baseline.
  4. Start the replay.
Step 6: Replay workload. Use SQL Profiler to measure CPU and IO.
Step 7: Compare the results with the baseline.
The results of the baseline and the first test are stored in 2 seperate tables. For instance: Table Baseline and Table Test1_Datacompression.
Use next query to compare the results:
SELECT 'Baseline' AS Test, COUNT(*) AS Queries,
    SUM(CPU) AS CPU,SUM(READS) AS Reads,
    SUM(Writes) AS Writes,SUM(Duration)/1000 AS Duration
FROM EOLSQL2008Replayresults.dbo.Baseline
WHERE EVENTCLASS in (10,12)
UNION ALL
SELECT 'Test1_Datacompression' AS Test, COUNT(*) AS Queries,
   SUM(CPU) AS CPU, SUM(READS) AS Reads,
   SUM(Writes) AS Writes, SUM(Duration)/1000 AS Duration
FROM EOLSQL2005Replayresults.dbo.Test1_Datacompression
WHERE EVENTCLASS in (10,12)

The number of queries should be the same because you replayed the same workload on both databases.
Success with your benchmark.

Wednesday, August 11, 2010

Forced parameterization does not work for partly parameterized queries.

In my previous blog I described how you can recognize a forced parameterized query. If you have set the parameterization option to forced on database level, you can still find some queries which are not parameterized. In this blog I will describe why?


Please use the AdventureWorks database to use the scripts.

USE AdventureWorks


--Enable the forced parameterization on the database
ALTER DATABASE AdventureWorks SET PARAMETERIZATION FORCED
GO
-- Clear the procedure cache
DBCC FREEPROCCACHE
GO
-- Update 2 different records both with an different Title.
UPDATE HumanResources.Employee SET Title = 'Support' WHERE ContactID = 1002
GO
UPDATE HumanResources.Employee SET Title = 'xx1290Support' WHERE ContactID = 1290
GO
-- Look in the procedure cache.

SELECT text,execution_count
FROM sys.dm_exec_query_stats AS qs CROSS APPLY
sys.dm_exec_sql_text(sql_handle) CROSS APPLY
sys.dm_exec_text_query_plan(qs.plan_handle, qs.statement_start_offset, qs.statement_end_offset) AS qp
order by text
-- You will find 1 entry Title and ContactID are parameterized.


-- Clear procedure cache
DBCC FREEPROCCACHE
Same query but ContactId is parameterized. Title is not parameterized.
GO
exec sp_executeSql N'UPDATE HumanResources.Employee SET Title = ''Support'' WHERE ContactID = @P1' ,N'@P1 INT',@P1 = 1002
GO
exec sp_executeSql N'UPDATE HumanResources.Employee SET Title = ''xx1290Support'' WHERE ContactID = @P1' ,N'@P1 INT',@P1 = 1290
GO
-- Look in the procedure cache
SELECT text,execution_count
FROM sys.dm_exec_query_stats AS qs CROSS APPLY
sys.dm_exec_sql_text(sql_handle) CROSS APPLY
sys.dm_exec_text_query_plan(qs.plan_handle, qs.statement_start_offset, qs.statement_end_offset) AS qp
order by text
-- You will find 2 entries. Forced parameterization does not work.
-- Clear procedure cache
DBCC FREEPROCCACHE

-- Same query ContactID and Title are parameterized.
exec sp_executeSql N'UPDATE HumanResources.Employee SET Title = @P2 WHERE ContactID = @P1' ,N'@P1 INT, @P2 varchar(20)',@P1 = 1002, @P2 = 'Support'
GO
exec sp_executeSql N'UPDATE HumanResources.Employee SET Title = @P2 WHERE ContactID = @P1' ,N'@P1 INT, @P2 varchar(20)',@P1 = 1290, @P2 = 'xx1290Support'
GO

-- Look in the procedure cache
SELECT text,execution_count
FROM sys.dm_exec_query_stats AS qs CROSS APPLY
sys.dm_exec_sql_text(sql_handle) CROSS APPLY
sys.dm_exec_text_query_plan(qs.plan_handle, qs.statement_start_offset, qs.statement_end_offset) AS qp
order by text
-- You will find 1 entry because the query is already parameterized.

Conclusion: Forced parameterization does only work if the query does not contain any parameter. If at least one parameter is defined, forced parametization does not work anymore.

Enjoy the use of forced parameterization in the right context.

Wednesday, July 28, 2010

Overview performance improvements in Exact Globe in the last years.

Photo credit Alancleaver_2000
Over the years a lot new release have become commercial available. A lot of new functionality has come available. With the information we received from customers who have used the Exact System Information tool we have seen that they are not aware of available functionality. The Exact System Information tool is made for customers to help them in improving the performance of their Exact solution. A lot of customers uses Exact Globe already for years. In their administration they have a lot of historical data. Some clean up applications has been made to clean up the database. This will result in a smaller backup and can help to improve the overall performance.

This blog post will give an overview of all performance improvements and cleanup functions.
  • Clean up log files. Release 360. Functionality is made to clean up ‘Application log’ or ‘Masterdata log’
  • Clean up of historical journal records. Release 360. Historical data in Globe is stored in multiple tables in the database. In the previous release of Globe application, there is no process in place to perform the clearing of old records. As the database size grows from period to period and from year to year, the system performance will be deteriorated
  • Database structure optimized. Release 370. Exact Globe 2003 database used data type CHAR instead of VARCHAR to store data with length more than 10 bytes. CHAR always uses fixed length to store data whereas VARCHAR uses dynamic length which depends on the actual size of the data. Therefore from a database structure standpoint, the database was not optimized. As a result, the following drawbacks were introduced. Record was unnecessarily bigger which caused slower queries because less record can be retrieved in one disk I/O. Indexes were bigger which again reduced query performance
  • Clean Up XML Import Logs. Product update 395. Whenever you import XML files to Exact Globe, the XML import results which are the log of the relevant events will be recorded. An option to remove the XML logs are added to the functionality for cleaning up logs.
  • Cleanup tool to delete obsolete logistic records and MRP planning records. Product update 395. Logistic processes in Exact Globe generate MRP planning records. Examples of logistic processes are sales orders, blanket sales orders, return to merchant authorization (RMA) orders, purchase orders, blanket purchase orders, return to vendor (RTV) orders, interbranch transfers, and quotations. Over the years, as customers’ databases become larger with logistic transactions, the database actions on these records become slower. Historical records such as completed sales or purchase orders may be considered obsolete after the completion of the logistic processes over a certain period of time. In order to enhance the performance of the administration, these obsolete logistics and planning records are best deleted.
  • Retrieving Balance Totals. Product update 395. Due to the database structure of Exact Globe, the retrieval of transaction totals requires the system to totalize all transactions. Over time, as your database becomes bigger and filled with transactions, the retrieval of balance totals becomes slower. Faster retrievals are therefore necessary to help you work more efficiently with the system. Enhancements have been made to improve the performance of retrieving balance totals
  • Database Performance by Optimizing Index. Product update 397. In every Exact Globe product update, system performance is improved by optimizing the database indices in Exact Globe. In this product update, a tool is implemented to optimize your database instead of the standard indices in Exact Globe. With this method, the indices will be deployed only when it is required by your SQL server. This method also reduces deployment risk because you can easily add or remove the indices if you are not satisfied with the performance result. There will also be performance improvement for functions that use the new index.
  • Cleanup tool to delete obsolete logistics records extended to Production Orders and Stock Allocations.Product update 398. The scope of the cleaning up tool is extended to completed production orders and all the respective allocation entries. The allocation entries refer to stock allocation records generated from back-to-back orders and sales order enrichments. Consequently, the absence of production orders and stock allocation is no longer the prerequisite for executing the tool.