Monday, November 28, 2011

Executionlog of SQL Azure Reporting reports .


In one of my previous blogs I wrote about performance tips to improve the performance of your SSRS reports. In this blog I wrote about the 3 different performance elements during the execution of a report:
  1. Time to retrieve the data (TimeDataRetrieval).
  2. Time to process the report (TimeProcessing)
  3. Time to render the report (TimeRendering)
Total time = (TimeDataRetrieval) + (TimeProcessing) + (TimeRendering)

As of SQL Server 2008 R2, this 3 performance components are logged every time for which a deployed report is executed. This information can be found in the table Executionlog3 in the ReportServer database. In SQL Azure Reporting you can't access the ExectionLog3 table, however it is still possible to get the contents of this table. To get the contents of this table do the following:

  1. Login to the Azure Management Portal.
  2. Select Reporting
  3. Select your reporting subscription.
  4. Press the Download Execution Log button in the top of the management portal.
  5. Select the date you want to export.
  6. Open the downloaded CSV file in Excel.

Thursday, November 17, 2011

How to find table scans in your database.

Table scans are in most scenarios not the best way to retrieve records from the database. However, sometimes is only possible by executing a table scan because no useful indexes are available. In this situation, you can avoid table scans by adding an index. First of all, how many table scans occur in your database? This information can be retrieved with Performance Monitor, but it is also possible to execute a query. Next script is very usefull to use to get information of your SQL Server.

DECLARE @CounterPrefix NVARCHAR(30)
SET @CounterPrefix = CASE
WHEN @@SERVICENAME = 'MSSQLSERVER'
THEN 'SQLServer:'
ELSE 'MSSQL$'+@@SERVICENAME+':'
END;

-- Capture the first counter set
SELECT CAST(1 AS INT) AS collection_instance ,[OBJECT_NAME],counter_name ,
instance_name,cntr_value,cntr_type,CURRENT_TIMESTAMP AS collection_time
INTO #perf_counters_init
FROM sys.dm_os_performance_counters
WHERE ( OBJECT_NAME = @CounterPrefix+'Access Methods'
    AND counter_name = 'Full Scans/sec')
   OR ( OBJECT_NAME = @CounterPrefix+'Access Methods'
    AND counter_name = 'Index Searches/sec')
   OR ( OBJECT_NAME = @CounterPrefix+'Buffer Manager'
    AND counter_name = 'Lazy Writes/sec')
   OR ( OBJECT_NAME = @CounterPrefix+'Buffer Manager'
    AND counter_name = 'Page life expectancy')
   OR ( OBJECT_NAME = @CounterPrefix+'General Statistics'
    AND counter_name = 'Processes Blocked')
   OR ( OBJECT_NAME = @CounterPrefix+'General Statistics'
    AND counter_name = 'User Connections')
   OR ( OBJECT_NAME = @CounterPrefix+'Locks'
    AND counter_name = 'Lock Waits/sec')
   OR ( OBJECT_NAME = @CounterPrefix+'Locks'
    AND counter_name = 'Lock Wait Time (ms)')
   OR ( OBJECT_NAME = @CounterPrefix+'SQL Statistics'
    AND counter_name = 'SQL Re-Compilations/sec')
   OR ( OBJECT_NAME = @CounterPrefix+'Memory Manager'
    AND counter_name = 'Memory Grants Pending')
   OR ( OBJECT_NAME = @CounterPrefix+'SQL Statistics'
    AND counter_name = 'Batch Requests/sec')
   OR ( OBJECT_NAME = @CounterPrefix+'SQL Statistics'
    AND counter_name = 'SQL Compilations/sec')

-- Wait on Second between data collection
WAITFOR DELAY '00:00:01'

-- Capture the second counter set
SELECT CAST(2 AS INT) AS collection_instance ,[OBJECT_NAME],counter_name ,
     instance_name,cntr_value,cntr_type,CURRENT_TIMESTAMP AS collection_time
INTO #perf_counters_second
FROM sys.dm_os_performance_counters
WHERE ( OBJECT_NAME = @CounterPrefix+'Access Methods'
     AND counter_name = 'Full Scans/sec')
   OR ( OBJECT_NAME = @CounterPrefix+'Access Methods'
     AND counter_name = 'Index Searches/sec')
   OR ( OBJECT_NAME = @CounterPrefix+'Buffer Manager'
     AND counter_name = 'Lazy Writes/sec')
   OR ( OBJECT_NAME = @CounterPrefix+'Buffer Manager'
    AND counter_name = 'Page life expectancy')
   OR ( OBJECT_NAME = @CounterPrefix+'General Statistics'
    AND counter_name = 'Processes Blocked')
   OR ( OBJECT_NAME = @CounterPrefix+'General Statistics'
    AND counter_name = 'User Connections')
   OR ( OBJECT_NAME = @CounterPrefix+'Locks'
    AND counter_name = 'Lock Waits/sec')
   OR ( OBJECT_NAME = @CounterPrefix+'Locks'
    AND counter_name = 'Lock Wait Time (ms)')
   OR ( OBJECT_NAME = @CounterPrefix+'SQL Statistics'
    AND counter_name = 'SQL Re-Compilations/sec')
   OR ( OBJECT_NAME = @CounterPrefix+'Memory Manager'
    AND counter_name = 'Memory Grants Pending')
   OR ( OBJECT_NAME = @CounterPrefix+'SQL Statistics'
    AND counter_name = 'Batch Requests/sec')
   OR ( OBJECT_NAME = @CounterPrefix+'SQL Statistics'
    AND counter_name = 'SQL Compilations/sec')

-- Calculate the cumulative counter values

SELECT i.OBJECT_NAME , i.counter_name , i.instance_name ,
    CASE WHEN i.cntr_type = 272696576
    THEN s.cntr_value - i.cntr_value
    WHEN i.cntr_type = 65792 THEN s.cntr_value
    END AS cntr_value
FROM #perf_counters_init AS i
JOIN #perf_counters_second AS s
ON i.collection_instance + 1 = s.collection_instance
   AND i.OBJECT_NAME = s.OBJECT_NAME
   AND i.counter_name = s.counter_name
   AND i.instance_name = s.instance_name
ORDER BY OBJECT_NAME

-- Cleanup tables
DROP TABLE #perf_counters_init
DROP TABLE #perf_counters_second

After executing this script you need to look to the values of : Full Scans/sec and Index searches/sec
Index scans should at least 300 times be bigger than Full Scans. To lower the number of Full Scans, you need to identify the queries which are using a table scan in their execution plan. This information can be retrieved from the procedure cache. In the execution plan you need to look for the syntax: 'TableScan'. This can be done with next query.
SELECT TOP 50 st.text AS [SQL], cp.cacheobjtype, cp.objtype,
   DB_NAME(st.dbid)AS [DatabaseName], cp.usecounts AS [Plan usage] , qp.query_plan
FROM sys.dm_exec_cached_plans cp
CROSS APPLY sys.dm_exec_sql_text(cp.plan_handle) st
CROSS APPLY sys.dm_exec_query_plan(cp.plan_handle) qp
WHERE CAST(qp.query_plan AS NVARCHAR(MAX)) LIKE ('%Tablescan%')
ORDER BY usecounts DESC

Now, we have the query which you can analyze in SSMS.

Thursday, November 10, 2011

My experience with (SQL) Azure. Azure Reporting and Azure Data Sync Preview.

In the past I have blogged about my first experience with SQL Azure and my first experience with SQL Azure Data Sync. In this blog I will give an update. A lot is changed. So time for an update.
  1. All Azure services are combined in one portal: The Azure Management portal.
    In this portal you have access to all relevant Azure services. For instance Database for SQL Azure, Data Sync for the Azure Data Sync framework and Reporting for Azure Reporting Services. I'm using Database, Data Sync and Reporting at this moment. 
  2. The performance of the management portal differs between the different Azure services. Database and Reporting responds with an acceptable performance. The Data Synce response times is too slow. A new management portal will be introduced in the Service release Q4 2011 in Metro Style. I do not like that every time the complete look and feel of the management portal is changed. Think before you deploy.
  3. Firewall still only supports IP version 4. IP version 6 adresses are not allowed.
  4. SQL Azure and Azure Reporting Server is now available in datacenters all over the world.
  5. Maximum database size is 50 Gb. This will increase to 150 GB as of service release Q4 2011.
  6. Database backup can be made by creating a copy of your database with next command:
    CREATE DATABASE Database1B AS COPY OF Database1A.
    Be aware that you now pay for an additional database because you created a second database. As alternative you can use BACPAC to store the backup in Azure Blob storage.
  7. SQL Profiler is still not supported but here you can vote to get it higher on the priority list. A lot of DMV's are added to get insight in query performance. However you can't get insight in query details for one application of user connection.
  8. The interface of Data Sync Preview version is much improved in comparison with the CTP2 version. However as mentioned in point 1, the performance is bad. For instance the refresh of  schema information.
  9. Data Synchronization of column names with spaces is not supported in the preview version. This will be fixed in the service release of end November 2011.
  10. You can synchronize a subset of a table by selecting the columns you need to sync and you can  configure row filtering by defining a filter clause.
  11. Changing a sync group is still not possible. This is a missing feature. You need to remove the sync group and create a new one. This is a lot of manual work.
  12. Changes in your data schema is still not support in Azure Data Sync.
  13. Deploy of on-premise reports to Azure reporting is really simple. You can deploy your on-premise reports to Azure reporting without changing the report. You only need to change the reporting server to which you want to deploy. Reports are the same only the URL is different.
  14. Management portal for Reporting looks good and contains all basic functions you need.
  15. Rendering of Azure reports are slow in comparison with SSRS on premise reports. I have uploaded some of my on premise reports to Azure reporting. I have uploaded my test database to SQL Azure. Azure Reports are genereated on the Azure database. This works great. Only the performance is different. After downloading the execution log, I could see that the performance decrease was caused by the rendering process. On my premise SSRS server it took 50 milliseconds to render this report. In Azure Reporting is took 6 seconds to render. To be clear, I used the same report on the same dataset. Click here to see that somebody else encoutered the same performance decrease. What can I do to improve the performance of my reports on the Azure Reporting server? 
  16. As you can see a lot is changed and good progress is made in the last year with the Azure platform. A big shift is made, SQL Azure is now in the lead in comparison to SQL Server on- premise. For instance SQL Azure is already running on SQL 2012 (codename Denali). Engine version 11.0.1476. SQL 2008 R2 is version 10.50.2500
  17. Performance of applications, reports etc. is something I always keep in mind. A lot is done the last year to give the user more insight in how his application\reports are running in the Azure platform.  It is not a black box anymore, but it is still dark gray. For a commercial use it should be clear why and how you can improve performance.

Wednesday, November 9, 2011

An impression to your future, with an important role for BI

Microsoft published a new video that shows how the company believes technology is poised to evolve over the next five to 10 years, based on the trends its researchers and engineers are seeing in software, devices, displays, sensors, processors and intelligent systems. You will see a lot of BI in this movie. BI will help you to get the information in the way you want and need it.


Enjoy it to have a look into your future.

Friday, November 4, 2011

How to implement style sheets in your SSRS reports?

Within SQL Server Reporting Services (SSRS), you have a lot of ways to style your reports. You can style your report in the way you want by using colors for text and background, fonts, font sizes etc... For instance:
However,  these styles are 'hard coded' in the report. You can see this in the RDL file of the report.


When the report is rendered as a HTML page it is not possible to allow Cascading Style Sheets (CSS) to be used. It is even not possible to enable a style to be configured by the user. This is a missing feature in SQL 2008 R2. SQL 2012 (codename Denali) will also not support style sheets. Style sheets can be very useful. For instance:
  • Assume you have applied your corporate branding to all your reports. Now the marketing department decide to change the corporate branding. You need manually change all your reports.
  • As an account you have build a report for your customer X in his corporate branding. This reports can't be re-used for customer Y. You need to build a second version of the report in the corporate branding of company Y.
In this blogpost I will describe what you can do to apply styles to your reports.

The style definition will not be stored in the report but in the database. By doing this, you can easily add new styles without the need to change your report. The report will make use of a Style parameter called @ReportStyeId. This parameter will retrieve the Style definition and will apply it to the report.

First we need to create some tables to store the style definition.

CREATETABLE SSRS_ReportStyle
   (ReportStyleId INT IDENTITY (1, 1),
    StyleName VARCHAR (80))

CREATE TABLE SSRS_Element
   (ElementId INT IDENTITY (1, 1),
    ElementName VARCHAR (80),
    ElementDefaultValue VARCHAR (80))

CREATE TABLE SSRS_ReportStyleElements
  (ReportStyleId INT,
   ElementId INT,
   ElementValue VARCHAR (80))

Add some style definition data to the tables:
-- SSRS_Report Style
SET IDENTITY_INSERT [SSRS_ReportStyle] ON
INSERT INTO [SSRS_ReportStyle] (ReportStyleId,StyleName)
   VALUES (1, 'Blue Yellow')
INSERT INTO [SSRS_ReportStyle] (ReportStyleId,StyleName
   VALUES (2, 'Red')
SET IDENTITY_INSERT [SSRS_ReportStyle] OFF

-- Insert SSRS_Elements like for instance font colors and background colors. Each element will
-- have a default value which will be used in case this element is not defined in the style.
SET IDENTITY_INSERT [SSRS_Element] ON
INSERT INTO [SSRS_Element]([ElementId],[ElementName],[ElementDefaultValue] )
   VALUES (1,'TABLE_HEADER_BG', 'WHITE')
INSERT INTO [SSRS_Element] ([ElementId],[ElementName],[ElementDefaultValue] )
   VALUES (2,'TABLE_HEADER_TEXT','BLACK')
INSERT INTO [SSRS_Element] ([ElementId],[ElementName],[ElementDefaultValue])
   VALUES (3,'TABLE_DETAIL_BG','WHITE')
INSERT INTO [SSRS_Element] ([ElementId],[ElementName],[ElementDefaultValue])
   VALUES (4,'TABLE_DETAIL_TEXT','BLACK')

-- SSRS_Report Style Elements, for every style element we can define the color, size etc.
INSERT INTO [SSRS_ReportStyleElements] ([ReportStyleId], [ElementId], [ElementValue] )
   VALUES ( 1, 1, 'BLUE' )
INSERT INTO [SSRS_ReportStyleElements] ([ReportStyleId], [ElementId], [ElementValue] )
   VALUES ( 1, 2, 'WHITE' )
INSERT INTO [SSRS_ReportStyleElements] ([ReportStyleId], [ElementId], [ElementValue] )
   VALUES ( 1, 3, 'YELLOW')
INSERT INTO [SSRS_ReportStyleElements] ([ReportStyleId], [ElementId], [ElementValue] )
   VALUES ( 1, 4, 'BLUE')
INSERT INTO [SSRS_ReportStyleElements] ([ReportStyleId], [ElementId], [ElementValue] )
   VALUES ( 2, 1, 'RED' )
INSERT INTO [SSRS_ReportStyleElements] ([ReportStyleId], [ElementId], [ElementValue] )
   VALUES ( 2, 2, 'YELLOW' )

Now, we have the style definition stored in the database. It's time to create a dataset to retrieve the style which can be used by the report Style parameter @ReportStyleId. The resultset of the dataset is 1 record with a column for every used style element. In this example I have 4 style elements. 1) Background  color header 2) Background color details 3) Color header font 4) Color detail text font. In the report definition we will use expressions for every style configuration. This expression will use a column from the style dataset.  To create a dataset with one record we need to use the PIVOT T-SQL syntax. Unfortunately the PIVOT T-SQL syntax is not supported as query text. Therefor a stored procedure with the PIVOT statement will be created. The dataset will use this stored procedure with a styleID parameter.

CREATE PROCEDURE [dbo].[SP_SSRS_ReportStyle]
  (@ReportStyleId AS int) AS
  (SELECT [TABLE_HEADER_BG],[TABLE_HEADER_TEXT],
                   [TABLE_DETAIL_BG], [TABLE_DETAIL_TEXT]
   FROM
    (SELECT e.[ElementName] , ISNULL(ElementValue,ElementDefaultValue) AS Value
     FROM [SSRS_Element] e WITH (NOLOCK)
     LEFT JOIN [SSRS_ReportStyleElements] rse WITH (NOLOCK)
          ON rse.[ElementId] = e.[ElementId] AND
                 rse.[ReportStyleId] = @ReportStyleId
     ) AS ReportStyleElements
  PIVOT (MIN(Value)
  FOR ElementName IN
         ([TABLE_HEADER_BG],[TABLE_HEADER_TEXT],
          [TABLE_DETAIL_BG], [TABLE_DETAIL_TEXT])) AS [Elements]
   )

If you want to use more style elements, you need to update the stored procedure to retrieve the added elements.

Now all preparations are done to implement the styles in your reports.
  • Open your report in BIDS.
  • Add dataset SSRSStyles to the report using Stored Procedure: SP_SSRS_ReportStyle

  • Create a parameter: @ReportStyleId with datatype Integer, allow null value, visible. Now the report can use the ReportStyle parameter.
  • Configure the background color of the header in your report to use the result set of the dataset. Do the same for the color of the font in the header.


  • Do the same for the detail rows in your report.
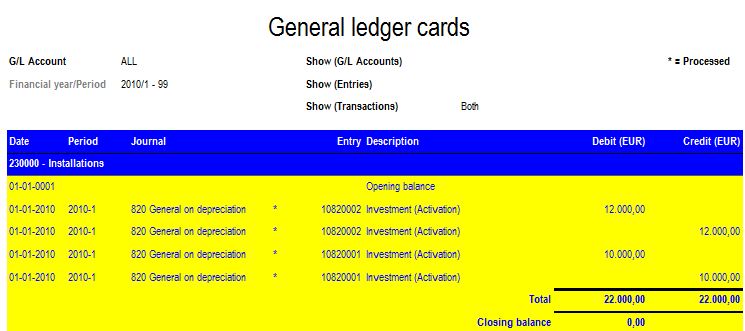
The report is ready to use. See the example for ReportStyle1

Example with ReportStyle 2

Enjoy it to implement styles to your SSRS reports.