
In SQL Server 2008 (R2) a lot of new features are build to improve the overall performance of your database. These features are mostly independent of your application. To implement these new features, you want to know what the impact is of an implemented feature. This blogpost will explain how SQL Profiler can help you to simulate 'production' workload on your database.
Some examples of these new features:
- Filtered indexes
- Data compression
- Optimize for ad-hoc workloads.
- Partitioned tables in combination with data compression
In general the replay process can divided into:
- Make a full backup of the production database.
- Capture workload with SQL Profiler.
- Restore production database on a test server.
- Replay workload to create baseline. Use SQL profiler to measure CPU and IO
- Restore production database and configure some of the new features.
- Replay workload. Use SQL Profiler to measure CPU and IO.
- Compare the results with the baseline.
Step 1: Make a full backup of your production database.
Step 2: Capture workload with SQL profiler
- Start SQL Profiler with the trace template 'TSQL_Replay' and a filter on the database id of your production database.
- Save the trace results to a new database on another SQL server as your production server.

- Select a database in which you want to store your replytraces and define a table name. In this example I have created a Database: ReplayTraces.

- Define a filter for the database of your production database. Use next query to retrieve the database ID of your production database:
SELECT Dbid FROM Master..SYSDatabases WHERE Name = '' - Start the profiler when the FULL BACKUP process is almost completed. Starting the replay just before the full backup is completed garantees that you have all queries which are executed after the full backup is completed.
- The profiler will now capture all executed queries on your production database.
- Stop the SQL Profiler trace at the moment you have captured enough data which can be representative for your tests.


Now we have a backup of the production database and a database with the captured workload. Be sure to have backups of these 2 database because you will need them a lot of times for your tests.
Restore the backup of your production database on your test server.
Step 4: Replay workload to create baseline. Use SQL profiler to measure CPU and IO
For a benchmark we need to have a baseline. To create a baseline execute next steps:
- Load the captured profile data in the SQL Profiler.
- Open SQL profiler and select File, Open, Trace Table.
- Select the SQL Server,Database and tablename in which you have captured the production workload.
To replay a trace against a server (the target) on which SQL Server is running other than the server originally traced (the source), make sure the following has been done:
- All logins and users contained in the trace must be created already on the target and in the same database as the source.
- All logins and users in the target must have the same permissions they had in the source.
- All login passwords must be the same as those of the user that executes the replay.
- The database IDs on the target should be the same as those on the source. If they are not the same you can do the following: Assume Source DBID = 10 Target DBID = 6. Detach your TestProduction database. Create a new database. This database will get DBID 6. Create 3 other Databases. The last created database will have DBID 9. Attach you TestProduction database. This will now get DBID 10.
- The default database for each login contained in the trace must be set (on the target) to the respective target database of the login. For example, the trace to be replayed contains activity for the login, Fred, in the database Fred_Db on the source. Therefore, on the target, the default database for the login, Fred, must be set to the database that matches Fred_Db (even if the database name is different). To set the default database of the login, use the sp_defaultdb system stored procedure.
- Create and start a SQL profile trace with a filter on the database ID of the restored production database on the test server. Save the results to a SQL Server database. This will be your baseline.
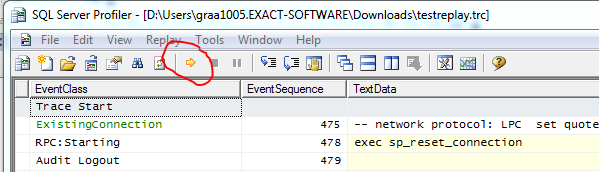
- To start the Replay, press the yellow arrow.
Step 5: Restore production database and configure some of the new features.
In the previous step we made the baseline. Now it is time to test the new features.
- Configure the new features you want to test.
- Load the captured profile data in the SQL Profiler
- Create and start a SQL profile trace with a filter on the database ID of the restored production database on the test server. Save the results to a SQL Server database in another table as you used for your baseline.
- Start the replay.
Step 6: Replay workload. Use SQL Profiler to measure CPU and IO.
Step 7: Compare the results with the baseline.
The results of the baseline and the first test are stored in 2 seperate tables. For instance: Table Baseline and Table Test1_Datacompression.
Use next query to compare the results:
SELECT 'Baseline' AS Test, COUNT(*) AS Queries,
SUM(CPU) AS CPU,SUM(READS) AS Reads,
SUM(Writes) AS Writes,SUM(Duration)/1000 AS Duration
FROM EOLSQL2008Replayresults.dbo.Baseline
WHERE EVENTCLASS in (10,12)
UNION ALL
SELECT 'Test1_Datacompression' AS Test, COUNT(*) AS Queries,
SUM(CPU) AS CPU, SUM(READS) AS Reads,
SUM(Writes) AS Writes, SUM(Duration)/1000 AS Duration
FROM EOLSQL2005Replayresults.dbo.Test1_Datacompression
WHERE EVENTCLASS in (10,12)
The number of queries should be the same because you replayed the same workload on both databases.
Success with your benchmark.


5 comments:
In step 4, it's a lot easier to change the dbid of the data in the table where the trace was taken rather than trying to change the actual dbid of the target database. I run traces against multiple databases at a time, so it only takes an extra couple minutes after the trace completes to compare dbids and change the trace table. Much easier IMHO.
How critical is the match between dbid of production and test DB for the trace replay? Will it not work the same way if the database names are same with different ids?
Ad, The DBid is the source the replay is using to replay. So make DBID the same. I have bad experience with tracing on database names. DBID will always work.
After running the trace, there is another way to sift through the information captured. I'm not a DBA, but I've been working with SQL for years now. Take a look at a utility called Trace Analyzer. If I remember correctly, the trial is a fully functional version. It's saved me an immense amount of time.
on Step 6) Replay workload. Use SQL Profiler to measure CPU and IO.
How CPU,Read,Write columns can capture,Since tsql replay output will not give these columns.....?
Post a Comment