Showing posts with label sql. Show all posts

Monday, October 21, 2013

Overview of the latest deadlocks on your SQL Server as of SQL 2008


In case you want to analyze the deadlocks which occur on your server, you can use the information from the SYSTEM_HELATH session.
Use next query to retrieve the latest deadlock information.
SELECT CAST(event_data.value('(event/data/value)[1]',
'varchar(max)') AS XML) AS DeadlockGraphFROM ( SELECT XEvent.query('.') AS event_data
FROM ( -- Cast the target_data to XML
SELECT CAST(target_data AS XML) AS TargetData
FROM sys.dm_xe_session_targets st
JOIN sys.dm_xe_sessions s
ON s.address = st.event_session_address
WHERE name = 'system_health'
AND target_name = 'ring_buffer'
) AS Data -- Split out the Event Nodes
CROSS APPLY TargetData.nodes('RingBufferTarget/
event[@name="xml_deadlock_report"]'
)
AS XEventData ( XEvent )
)
AS tab ( event_data )
 
Be aware that, due to changes in the deadlock graph to support multi-victim deadlocks, and to minimize the size of the event data, the resulting XML cannot be saved as an XDL file for graphical representation.
More information about analyzing deadlocks can be found here

Tuesday, July 16, 2013

The selected Subscriber does not satisfy the minimum version compatibility level of the selected publication


The error message as mentioned in the title: 'The selected Subscriber does not satisfy the minimum version compatibility level of the selected publication' , can occur when you are setting up a subscription from a SQL 2008 R2 publisher to a SQL 2012 subscriber using SQL Server Management Studio (SSMS) version of SQL 2008 R2.
This error is caused by SSMS.

Solution:
Use the SSMS version of SQL 2012, now you are able to setup the Subscription from a SQL2008 R2 publisher to a SQL 2012 subscription.

Friday, May 24, 2013

How to retrieve IO statistics of SQL databases on file level?


Performance of a SQL database depends on different factors. One of these factors is disk activity, also known as Disk IO. With Windows Performance monitor (Perfmon) you can measure the performance of your disk. However if you have 4 database files on 1 drive, you do not know which of your databases is causing the most Disk IO. Within SQL Server you can use a dynamic view which will give you information on database file level.  Execute next statement on the SQL Server:

SELECT d.name  ,s.filename, NumberReads,  NumberWrites,  BytesRead,BytesWritten,
 IoStallReadMS, IoStallWriteMS, IoStallMS,BytesOnDisk
FROM Fn_Virtualfilestats(NULL,NULL) f
INNER JOIN sys.sysaltfiles s ON f.dbid = s.dbid and f.FileId = s.fileid
INNER JOIN sys.databases d ON f.DbId = d.database_id
ORDER BY IoStallReadMS DESC

This query will show next columns:

Name: Database name
Filename: Filename of the database file. Look to the extension to see if it is the MDF or LDF file
Timestamp: Database timestamp at which time the data was taken
Number of reads: Number of reads issued on the file
BytesRead: Number of bytes read issued on the file
IoStallReadMS: Total amount of time, in milliseconds, that users waited for the read IOs to complete the file
Number of writes: Number of writes issued on the file
BytesWritten: Number of bytes written issued on the file
IoStallWriteMS: Total amount of time, in milliseconds, that users waited for the read IOs to complete the file
BytesOnDisk: Physical file size(count of bytes) on disk.


With this query, you can look which databases are generating the most IO and time database files are waiting on the disk to get the required data. This can help you to decide to move some database files to seperate disks.

Friday, April 5, 2013

Tsql script to see creation anf modification time of all indexes in database.

Next script will show the modification date of all indexes in the selected database.

Select s.name, t.name, t.create_date, t.modify_date,i.name, c.name
From sys.tables t
inner join sys.schemas s on t.schema_id = s.schema_id
inner join sys.indexes i on i.object_id = t.object_id
inner join sys.index_columns ic on ic.object_id = t.object_id
inner join sys.columns c on c.object_id = t.object_id and
             ic.column_id = c.column_id
Where i.index_id > 0   
and i.type in (1, 2) -- clustered & nonclustered only
and i.is_primary_key = 0 -- do not include PK indexes
and i.is_unique_constraint = 0 -- do not include UQ
and i.is_disabled = 0
and i.is_hypothetical = 0
and ic.key_ordinal > 0
Order by 4 desc

Wednesday, August 8, 2012

How to use Dynamic data sources in your SSRS report.


You can have situations in which your report should be executed on multiple databases. The user should be able to select the desired database on which the report should run. In this blog post I will explain how you can do this.
To be able to select to different database you need to make use of a dynamic data source. A data source makes use of a connection string. It is possible to pass the connection string of a data source as an expression. By using an expression, you can make use of parameter values to pass the servername and database name to the connection string. There is only one restriction of a dynamic data source. The data source should be embedded within the report. It can not be implemented with a shared data source. In this blogpost I will use a second database in which I retrieve the available SQL server\databases on which my reports should be executed.
  • Open your report
  • Add 2 report parameters
    • ServerName
    • DatabaseName
  • Add datasource named: DynamicDataSource. Use the a 'hard coded' connection string. For instance:  Data Source=MySQLServer1;Initial Catalog=MyDatabase1.

  • Add datasource to the database with all SQL Server\databases. In my example named: Synergy
  • Add a embedded dataset to retrieve SQL Server and Database information.
  • Configure the available values for the report parameters: ServerName and DatabaseName.
  • Add all datasets and report items to your report.
  • Test your report using the 'hard coded' connection string.
  • If everything works fine, change the 'hard coded' connection string with next expression
    ="data source=" & Parameters!ServerName.Value & ";initial catalog=" & Parameters!DatabaseName.Value
  • Run the report and select a value for the report parameters ServerName and DatabaseName 

Enjoy it.

Wednesday, March 14, 2012

How to pass NULL value to a Multi value parameter in SSRS?


This week I tried to build a SSRS report with a parameter which can have multiple values including the NULL value. This is not possible by default in SSRS. When you configure the parameter with option: Allow null value and Allow multiple values. You will receive next error message:

A multi-value parameter cannot include null values.

The reason for this is the TSql syntax of the underlying dataset.

SELECT Column1, Column3
FROM TableX
WHERE Column2 IN (@MyParameter)

This query will fail for the NULL value because IN syntax is in conflict with NULL value. TSql syntax for NULL values is

SELECT Column1, Column3
FROM TableX
WHERE Column2 IS NULL

Solution:
We are going to use the ISNULL function to change parameter values to a blank value (''). Assume you have a dataset to retrieve parameter values for @MyParameter.

SELECT DISTINCT(Col1) FROM TableB

Change this query to:

SELECT DISTINCT ISNULL(Col1, '') AS Col1, ISNULL(Col1, 'NULL') AS Col1Description
FROM TableB
Change the Report Parameter Properties to: Allow blank values ('') and Allow multiple values.
Change the available values: Value field: Col1   , Label field: Col1Description.


Now we need to change the query of the dataset.
-- Original query
SELECT Column1, Column3
FROM TableX
WHERE Column2 IN (@MyParameter)

-- Changed query
SELECT Column1, Column3
FROM TableX
WHERE  ISNULL(Column2,'')  IN (@MyParameter)

That's all, enjoy it to make your report more user friendly.

Thursday, February 17, 2011

SQL Azure backup and restore strategy. Things to keep in mind.


With SQL Azure you have a SQL Server database in the cloud. This can be very useful, however there are some differences between the on premise SQL Server databases and the cloud SQL Server databases. One of the differences is the Backup and Restore Strategy. In general, the purpose of creating backups is to enable you to recover from:
  • Hardware failures
  • Application errors
  • User errors.
The SQL Azure environment is designed to maintain the server available along with data integrity of your data in case of hardware failure. In other words, your backup and restore strategy doesn’t have to plan for hardware failure of your SQL Azure databases. For application or user errors, you still need a backup and restore strategy. SQL Azure requires its own backup and restore strategy because of the environment and tools available. In many ways the risks have been mediated by the database being in the Microsoft data centers. The tools that are available as of today cover the other risk factors, however better tools are coming to make the job much easier. Please read SQL Azure Backup and Restore strategy for more details about the available tools and commands.

Thursday, August 26, 2010

Use SQL profiler replay traces to benchmark performance of your SQL server database.


In SQL Server 2008 (R2) a lot of new features are build to improve the overall performance of your database. These features are mostly independent of your application. To implement these new features, you want to know what the impact is of an implemented feature. This blogpost will explain how SQL Profiler can help you to simulate 'production' workload on your database.
Some examples of these new features:
The biggest challenge in simulating workload is to get a workload which is comparable to the workload in the production environment. This is possible with SQL Profiler. With SQL profiler you can capture the workload on your production database. This capture can be used as workload on a copy of your production database.

In general the replay process can divided into:

  1. Make a full backup of the production database.
  2. Capture workload with SQL Profiler.
  3. Restore production database on a test server.
  4. Replay workload to create baseline. Use SQL profiler to measure CPU and IO
  5. Restore production database and configure some of the new features.
  6. Replay workload. Use SQL Profiler to measure CPU and IO.
  7. Compare the results with the baseline.

Step 1: Make a full backup of your production database.

Step 2: Capture workload with SQL profiler
  1. Start SQL Profiler with the trace template 'TSQL_Replay' and a filter on the database id of your production database.
  2. Save the trace results to a new database on another SQL server as your production server.


  3. Select a database in which you want to store your replytraces and define a table name. In this example I have created a Database: ReplayTraces.

     
  4. Define a filter for the database of your production database. Use next query to retrieve the database ID of your production database:
    SELECT Dbid FROM Master..SYSDatabases WHERE Name = ''
  5. Start the profiler when the FULL BACKUP process is almost completed. Starting the replay just before the full backup is completed garantees that you have all queries which are executed after the full backup is completed.
  6. The profiler will now capture all executed queries on your production database.
  7. Stop the SQL Profiler trace at the moment you have captured enough data which can be representative for your tests.
Step 3: Restore production database on a test server.

Now we have a backup of the production database and a database with the captured workload. Be sure to have backups of these 2 database because you will need them a lot of times for your tests.
Restore the backup of your production database on your test server.


Step 4: Replay workload to create baseline. Use SQL profiler to measure CPU and IO

For a benchmark we need to have a baseline. To create a baseline execute next steps:
  1. Load the captured profile data in the SQL Profiler.
  2. Open SQL profiler and select File, Open, Trace Table.
  3. Select the SQL Server,Database and tablename in which you have captured the production workload.
SQL Profiler Replay Requirements:
To replay a trace against a server (the target) on which SQL Server is running other than the server originally traced (the source), make sure the following has been done:

  • All logins and users contained in the trace must be created already on the target and in the same database as the source.
  • All logins and users in the target must have the same permissions they had in the source.
  • All login passwords must be the same as those of the user that executes the replay.
  • The database IDs on the target should be the same as those on the source. If they are not the same you can do the following: Assume Source DBID = 10 Target DBID = 6. Detach your TestProduction database. Create a new database. This database will get DBID 6. Create 3 other Databases. The last created database will have DBID 9. Attach you TestProduction database. This will now get DBID 10.
  • The default database for each login contained in the trace must be set (on the target) to the respective target database of the login. For example, the trace to be replayed contains activity for the login, Fred, in the database Fred_Db on the source. Therefore, on the target, the default database for the login, Fred, must be set to the database that matches Fred_Db (even if the database name is different). To set the default database of the login, use the sp_defaultdb system stored procedure.
More information about replay requirements can be found here

  1. Create and start a SQL profile trace with a filter on the database ID of the restored production database on the test server. Save the results to a SQL Server database. This will be your baseline.
  2. To start the Replay, press the yellow arrow.

Step 5: Restore production database and configure some of the new features.
In the previous step we made the baseline. Now it is time to test the new features.
  1. Configure the new features you want to test.
  2. Load the captured profile data in the SQL Profiler
  3. Create and start a SQL profile trace with a filter on the database ID of the restored production database on the test server. Save the results to a SQL Server database in another table as you used for your baseline.
  4. Start the replay.
Step 6: Replay workload. Use SQL Profiler to measure CPU and IO.
Step 7: Compare the results with the baseline.
The results of the baseline and the first test are stored in 2 seperate tables. For instance: Table Baseline and Table Test1_Datacompression.
Use next query to compare the results:
SELECT 'Baseline' AS Test, COUNT(*) AS Queries,
    SUM(CPU) AS CPU,SUM(READS) AS Reads,
    SUM(Writes) AS Writes,SUM(Duration)/1000 AS Duration
FROM EOLSQL2008Replayresults.dbo.Baseline
WHERE EVENTCLASS in (10,12)
UNION ALL
SELECT 'Test1_Datacompression' AS Test, COUNT(*) AS Queries,
   SUM(CPU) AS CPU, SUM(READS) AS Reads,
   SUM(Writes) AS Writes, SUM(Duration)/1000 AS Duration
FROM EOLSQL2005Replayresults.dbo.Test1_Datacompression
WHERE EVENTCLASS in (10,12)

The number of queries should be the same because you replayed the same workload on both databases.
Success with your benchmark.

Thursday, March 4, 2010

My SQL LDF file is so big in comparison with the MDF file, what can I do ?

At a lot of customer sites I  have seen situations in which the transaction log file (LDF) is multiple times bigger than the MDF file. This is not a 'normal' situation. In this blog I will explain what you can do if you have an LDF file of your SQL server database which is too big in comparison with the size of your MDF file.


What is the difference between the MDF and LDF file ?
The .MDF file is the primary data file of a SQL database. The .LDF file is the transaction log file of a SQL database. The transaction log is used to guarantee the data integrity of the database and for data recovery. Data integrity is implemented by design and can't be configured by the database administrator. Data recovery is implemented by design and is configurable by the database administrator.

In SQL Server you have 3 different data recovery models: Simple, Full and bulk-logged. Typically, a database uses the Full recovery model or Simple recovery model.

What is the main difference between Full and Simple?
  • Simple: No transaction log backups. Changes since the most recent backup are unprotected. In the event of a disaster, those changes are lost and need to be redone. You can only recover to the end of a backup.
  • Full: Requiers transaction log backups. No work is lost due to a lost or damaged data file. Can recover to a specific point in time, assuming that your backups are complete up to that point in time. For example, prior to application or user error. 

What is in the transaction log in the Simple recovery model ?
All open transactions. This means not committed transactions. This is called the active part of the transaction log. At the moment a transaction is committed it will be truncated from the transaction log. Log truncation automatically frees disk space for reuse by the transaction log. The biggest size of the transaction log will be the size of all open transactions at one moment. Therefor in a 'normal' SQL production database the transaction log file will never get very big.

What is in the transaction log in the Full recovery model ?
All committed transaction (inactive part) and open transactions (active part). The log records cannot be truncated untill all its log records have been captured in a transaction log backup. The log is truncated when you backup the transaction log.

What can we do to lower the size of the transactional log file (LDF)?
It depends on the configured recovery model of your database, what you can do. The recovery model of your database can be found in the properties of the database:

or via SSMS:
Open a query window and select the database.

USE
SELECT Recovery_model_desc FROM sys.databases WHERE Name = db_name()


What to do if your recovery model is: FULL?
Check if you are making transactional backups on a reguler time interval. If you only make full backups your transaction log will always grow and will never be truncated. In case you never want to lose data in case of a application or user error. Start making transactional log backups. If a database restore to the latest full backup is acceptable, you can switch the recovery model of your database to simple. Before switching the recovery model of your database please read next document: Considerations from switching the recovery model of your database. After switching to the recovery model Simple , you can shrink the log file. See the end of this blog how to do this.


What to do if your recovery model is: Simple?
Shrink the log file.


To set the recovery model to Simple you can run next query:
ALTER DATABASE
SET RECOVERY SIMPLE

To set the recovery model to FULL you can run next query:
ALTER DATABASE
SET RECOVERY FULL

How many free space is available in my log file?
  • Select the database in the Object Explorer
  • Point to Tasks, Point to Shrink and then click Files.
  • Select File Type: Log
  • Currently allocated: The current size of your log file
  • Available free space: The free space in your log file
To shrink the log file:
  • Select the database in the Object Explorer
  • Point to Tasks, Point to Shrink and then click Files.
  • Select File Type: Log
  • Select Release unused space
  • Press OK to start the shrink process. If you do not want to shrink the log file press the cancel button.

Monday, October 5, 2009

IIS Database Manager to easily manage your local and remote databases within IIS Manager

IIS Database Manager allows you to easily manage your local and remote databases from within IIS Manager. IIS Database Manager automatically discovers databases based on the Web server or application configuration and also provides the ability to connect to any database on the network. Once connected, IIS Database Manager provides a full array of management options including managing tables, views, stored procedures and data, as well as running ad hoc queries.

IIS Database Manager provides native support for SQL Server and is also fully extensible for developers to add support for other database systems. In addition, because IIS Database Manager is an extension of IIS Manager, administrators can securely delegate the management of databases to authorized local or remote users, without having to open additional management ports on the server.


First of all install the IIS Database Manager of your web server.
Start the IIS Manager.
Select your web server
In the management view click on the Database Manager icon


Create a database connection to the database you want:


Open your connection:


Press on the new query button:


Now you can start executing queries on your database


Be aware this is a simple query analyzer. You can't for instance retrieve query plans etc. But for simple checks it can be a nice tool without the need to install the full SQL Server Management Studio (SSMS)


Friday, August 28, 2009

Index statistics and suggestions of a table in one query.

To optimize the index structure of tables in your database, you need to get information how these indexes are used. On the other hand you want to know if new indexes can improve the performance of your database. Index usage statistics and index suggestions are stored by the SQL Server engine as of SQL 2005.  With next query you can combine the index usages statistics and suggestions in one query. It will help you to improve the performance of your database.

Be aware to look very critical to all index suggestions. Suggestions have no relation to each other. Therefor do not add all index suggestions at the same. Add one index and analyze the results after a while and re-execute the query.

To use this script specify the table you want to analyze in the second line. In this example the table GBKMUT is analyzed.  If the table you specified does not exist, it will return all statistics and suggestions of all table in your database. A lot of success with improving your database.

DECLARE @ObjectID int

SELECT @ObjectID = OBJECT_ID('GBKMUT')

;WITH preIndexAnalysis
AS (
SELECT
OBJECT_SCHEMA_NAME(t.object_id) as schema_name
,t.name as table_name
,COALESCE(i.name, 'N/A') as index_name
,CASE WHEN i.is_unique = 1 THEN 'UNIQUE ' ELSE '' END + i.type_desc as type_desc
,NULL as impact
,ROW_NUMBER()
OVER (PARTITION BY i.object_id ORDER BY i.is_primary_key desc, ius.user_seeks + ius.user_scans + ius.user_lookups desc) as ranking
,ius.user_seeks + ius.user_scans + ius.user_lookups as user_total
,COALESCE(CAST(100 * (ius.user_seeks + ius.user_scans + ius.user_lookups)
/(NULLIF(SUM(ius.user_seeks + ius.user_scans + ius.user_lookups)
OVER(PARTITION BY i.object_id), 0) * 1.) as decimal(6,2)),0) as user_total_pct
,ius.user_seeks
,ius.user_scans
,ius.user_lookups
,STUFF((SELECT ', ' + QUOTENAME(c.name)
FROM sys.index_columns ic
INNER JOIN sys.columns c ON ic.object_id = c.object_id AND ic.column_id = c.column_id
WHERE i.object_id = ic.object_id
AND i.index_id = ic.index_id
AND is_included_column = 0
ORDER BY index_column_id ASC
FOR XML PATH('')), 1, 2, '') AS indexed_columns
,STUFF((SELECT ', ' + QUOTENAME(c.name)
FROM sys.index_columns ic
INNER JOIN sys.columns c ON ic.object_id = c.object_id AND ic.column_id = c.column_id
WHERE i.object_id = ic.object_id
AND i.index_id = ic.index_id
AND is_included_column = 1
ORDER BY index_column_id ASC
FOR XML PATH('')), 1, 2, '') AS included_columns
,i.object_id
,i.index_id
,STUFF((SELECT ', ' + QUOTENAME(ic.column_id,'(')
FROM sys.index_columns ic
WHERE i.object_id = ic.object_id
AND i.index_id = ic.index_id
AND is_included_column = 0
ORDER BY index_column_id ASC
FOR XML PATH('')), 1, 2, '') AS indexed_columns_compare
,COALESCE(STUFF((SELECT ', ' + QUOTENAME(ic.column_id, '(')
FROM sys.index_columns ic
WHERE i.object_id = ic.object_id
AND i.index_id = ic.index_id
AND is_included_column = 1
ORDER BY index_column_id ASC
FOR XML PATH('')), 1, 2, ''), SPACE(0)) AS included_columns_compare
FROM sys.tables t
INNER JOIN sys.indexes i ON t.object_id = i.object_id
LEFT OUTER JOIN sys.dm_db_index_usage_stats ius ON i.object_id = ius.object_id AND i.index_id = ius.index_id AND ius.database_id = db_id()
WHERE t.object_id = @ObjectID OR @ObjectID IS NULL
UNION ALL
SELECT
OBJECT_SCHEMA_NAME(mid.object_id) as schema_name
,OBJECT_NAME(mid.object_id) as table_name
,'--MISSING--'
,'--NONCLUSTERED--'
,(migs.user_seeks + migs.user_scans) * migs.avg_user_impact as impact
,0 as ranking
,migs.user_seeks + migs.user_scans as user_total
,NULL as user_total_pct
,migs.user_seeks
,migs.user_scans
,0 as user_lookups
,COALESCE(equality_columns + ', ', SPACE(0)) + COALESCE(inequality_columns, SPACE(0)) as indexed_columns
,included_columns
,mid.object_id
,NULL
,NULL
,NULL
FROM sys.dm_db_missing_index_details mid
INNER JOIN sys.dm_db_missing_index_groups mig ON mid.index_handle = mig.index_handle
INNER JOIN sys.dm_db_missing_index_group_stats migs ON mig.index_group_handle = migs.group_handle
WHERE database_id = db_id()
AND mid.object_id = @ObjectID OR @ObjectID IS NULL
)
SELECT schema_name
,table_name
,index_name
,type_desc
,impact
,user_total
,user_total_pct
,CAST(100 * (user_seeks + user_scans + user_lookups)
/(NULLIF(SUM(user_seeks + user_scans + user_lookups)
OVER(PARTITION BY schema_name, table_name), 0) * 1.) as decimal(6,2)) as estimated_percent
,user_seeks
,user_scans
,user_lookups
,indexed_columns
,included_columns
,STUFF((SELECT ', ' + index_name AS [data()]
FROM preIndexAnalysis iia
WHERE ia.object_id = iia.object_id
AND ia.index_id <> iia.index_id
AND ia.indexed_columns_compare = iia.indexed_columns_compare
AND ia.included_columns_compare = iia.included_columns_compare
FOR XML PATH('')), 1, 2, '') AS duplicate_indexes
,STUFF((SELECT ', ' + index_name AS [data()]
FROM preIndexAnalysis iia
WHERE ia.object_id = iia.object_id
AND ia.index_id <> iia.index_id
AND (ia.indexed_columns_compare LIKE iia.indexed_columns_compare + '%'
OR iia.indexed_columns_compare LIKE ia.indexed_columns_compare + '%')
AND ia.indexed_columns_compare <> iia.indexed_columns_compare
FOR XML PATH('')), 1, 2, '') AS overlapping_indexes
FROM preIndexAnalysis ia
ORDER BY schema_name, table_name, ROW_NUMBER() OVER (PARTITION BY schema_name, table_name ORDER BY user_total desc, ranking), index_name

Sunday, June 14, 2009

How to debug your SQL server query?

Have you ever wondered why your query is not doing as what you expected?
Have you ever add extra lines in your query to print parameter values, so you better understand what is happening?

If you answer one of these questions with No, you are a really good query builder or you never build queries. If you answer one of these questions with Yes, this blog post can be something for you.

Within SQL 2008 a debug option is introduced in the SQL Server Management Studio (SSMS).
It is the green arrow. In previous versions of SSMS, this green button is the execute button.
To demonstrate the debug option I will use a simple query:

DECLARE @Rownumber INT = 0

WHILE @Rownumber < 10
BEGIN
SELECT @@SERVERNAME
END

This query will never end. This is because @Rownumber does not change.
Now we will start debugging this query.

  1. Set your cursor on SELECT @@SERVERNAME and
  2. Pres F9 to set a breakpoint. A red circle will appear.
  3. Press ALT F5.  In your 'locals' window the @Rownumber will appear without any value.
  4. Press ALT F5. Debugging is started and will stop on the breakpoint. The @Rownumber has now a value of 0. This is what you expect.
  5. Press ALT F5 to continue. The servername will be returned.
  6. Press ALT F5 to continue. Another time the servername will be returned. However the value of @Rownumber is still on zero. This explains why the query never stops. The @Rownumber will never get 10.
  7. Stop debugging with SHIFT F5
  8. Add next statement SET @Rownumber = @Rownumber + 1
    So we get next script:

    DECLARE @Rownumber INT = 0

    WHILE @Rownumber < 10
    BEGIN
    SELECT @@SERVERNAME
    SET @Rownumber = @Rownumber + 1
    END
  9. Set breakpoint on the same line: SELECT @@SERVERNAME
  10. Start debugging by pressing ALT F5 a few times. You will see that the value of @Rownumber is growing and the query will stop when the value reaches 9.

Enjoy this feature when you do not understand what your query is doing. Unfortunately, this debug feature is only available in SQL Server 2008. Maybe another reason to upgrade to SQL Server 2008.

Tuesday, April 21, 2009

Exact System Information application: Why should you use it?

This is my third blog post about the Exact System Information application. In the first 2 blogposts I introduced the reason of the Exact System Information application and what kind of information is retrieved by the Exact System Information application. In this blogpost I will explain why you as valuable customer should start this application on your SQL Server.
With the information we received from your Exact databases, we are able to improve our software. However improvements in the software based on this data will cost time and you will not directly benefit of it.

So the question is: What kind of improvements are directly possible for you to implement?

I will give some examples to:
SQL Server configuration improvements:


Example: Database configuration improvement scripts:

Example: Not used Exact functionality: Clean up historical journal records to save database size.

These are some examples. To experience all possible improvements, please start the application on your SQL server. The application is available on : ftp://ftp.exact.nl/Software/ESI/ExactSysInfo.zip. Extract the zip file on your SQL server and start the ExactSysInfo.exe
After we have received your data we will analyze the data. Via the support department you can request the improvement report. In the future we will distribute this improvement report via our portals.

Thank you already for your cooperation and trust in Exact Software.

Wednesday, April 15, 2009

Troubleshooting Performance Problems in SQL Server 2008


Microsoft has published an interesting article (97 pages) about troubleshooting Performance Problems in SQL Server 2008. This is a must to read for people interesting in performance analyzing and optimization of your SQL Server.  It provide information to find:
  1. Resource bottlenecks
  2. CPU bottlenecks
  3. Memory bottlenecks
  4. I/O bottlenecks
  5. Tempdb issues
  6. Slow Running Queries.
 The full article can be found here:  http://msdn.microsoft.com/en-us/library/dd672789.aspx

Enjoy it.

Tuesday, April 7, 2009

SQL Server maintenance on your SQL databases to improve performance.

Image credit: Gopal1035


Introduction:
Performance of applications on SQL Server depends on different factors. This can be hardware configuration, hardware capacity, application problems, SQL server configuration and maintenance on SQL Server database. See for instance documents:
This document will describe what kind of database maintenance activities can be done to get better performance of your SQL database. Be aware that this will contribute to a better performing system, but this will not the solution for all performance problems.
Goal:
Better performance of the database with the same hardware and software.

Solution:
To get better performance of your SQL database next maintenance activities can be executed.
  1. Defragmentation of clustered indexes
  2. Update statistics of most important tables with full scan
  3. Defragmentation indexes

Ad 1) Defragmentation of clustered indexes.

How to:
A clustered index indicates the order in which table data should be physically stored. The table data is sorted and stored according to the key column or columns specified for the clustered index. Because the data is physically stored in a specific order, you can create only one clustered index per table. For instance the table GBKMUT of Exact Globe or Exact Synergy Enterprise has a clustered index on the field ID. All records will be physically stored in the order of ID. New records will be added at the end of the table. All data rows are stored in data pages. One data page contains multiple data rows. When GBKMUT records are deleted, for instance MRP records, you will get caps between the ID’s. A part of the data page to which the deleted GBKMUT records belongs is now empty. This is called fragmentation of the clustered index. This will result in more reads to retrieve the same amount of data. With next command you can retrieve the fragmentation percentage of a clustered index:

dbcc
showcontig ('<tablename>', 1)

Example for table GBKMUT
dbcc showcontig ('GBKMUT', 1)

When executing
dbcc showcontig ('GBKMUT', 1) next results are displayed.

DBCC SHOWCONTIG scanning 'gbkmut' table...
Table: 'gbkmut' (1019866700); index ID: 1, database ID: 5
TABLE level scan performed.
- Pages Scanned................................: 3037060
- Extents Scanned..............................: 385999
- Extent Switches..............................: 535838
- Avg. Pages per Extent........................: 7.9
- Scan Density [Best Count:Actual Count].......: 70.85% [379633:535839]
- Logical Scan Fragmentation ..................: 3.53%
- Extent Scan Fragmentation ...................: 37.17%
- Avg. Bytes Free per Page.....................: 612.5
- Avg. Page Density (full).....................: 92.43%
DBCC execution completed. If DBCC printed error messages, contact your system administrator.

The most optimal situation is a table with a scan density of 100 %. In this example 30 % of the pages are not used. To optimize the scan density use next command for a unique clustered index:

CREATE UNIQUE CLUSTERED INDEX <Clustered index name> ON <tablename> (<fields) with drop_existing

To optimize the scan density use next command for a non unique clustered index:

CREATE CLUSTERED INDEX <Clustered index name> ON <tablename> (<fields) with drop_existing

Example for table GBKMUT batch 360 which has a unique clustered index.
CREATE UNIQUE CLUSTERED INDEX PK_gbkmut ON gbkmut (ID) with drop_existing

When:
Not scheduled. Check can be executed on a weekly or monthly basis. Rebuild should be done when the specific table is not used by other users. Therefore a repair can’t be scheduled on a regular basis.


Ad 2) Update statistics of most important tables with full scan

How to:
Statistics are the basis for the SQL optimizer to generate the most optimal query plan. By default statistics are updated automatically. These statistics are updated by using a sample of the data. This is correct but sometimes it can happen that the default sample rate is too small. In these cases an update of the statistics should be execute.
Statistics can be updated with next command:

UPDATE STATISTICS <Table name> WITH FULLSCAN

To update table gbkmut with a fullscan use next command:

UPDATE STATISTICS GBKMUT WITH FULLSCAN

Depending on the amount of indexes and the amount of records this can take a while.

When:
Updating statistics of a table can be done while the table is used by other people. However it will have a negative impact on performance because all records in the table are retrieved. Therefore this can be scheduled on a daily or weekly basis when the use of the system is minimal. For instance during the night or during the weekend.


Ad 3) Defragmentation of indexes.
During the use of a table (Update, insert and deletes) fragmentation of data and indexes can occur. This will result in more reads to retrieve the same amount of data.

How to:
With next script all indexes of all tables in the database with a fragmentation > 30 % will be optimized.
/*Perform a 'USE <database name>' to select the database in which to run the script.*/
-- Declare variables
SET NOCOUNT ON
DECLARE @tablename VARCHAR (128)
DECLARE @Query NVARCHAR(255)
DECLARE @IxName VARCHAR (255)
DECLARE @IxId Int
DECLARE @ObjId Int
DECLARE @ScanDensity DECIMAL
DECLARE @maxfrag DECIMAL

-- Decide on the mimimum fragmentation to allow
SELECT @maxfrag = 70.0

-- Declare cursor
DECLARE tables CURSOR FOR
SELECT Name FROM sysobjects where xtype='U'

-- Create the table
CREATE TABLE #fraglist (
ObjectName CHAR (255),
ObjectId INT,
IndexName CHAR (255),
IndexId INT,
Lvl INT,
CountPages INT,
CountRows INT,
MinRecSize INT,
MaxRecSize INT,
AvgRecSize INT,
ForRecCount INT,
Extents INT,
ExtentSwitches INT,
AvgFreeBytes INT,
AvgPageDensity INT,
ScanDensity DECIMAL,
BestCount INT,
ActualCount INT,
LogicalFrag DECIMAL,
ExtentFrag DECIMAL)

-- Open the cursor
OPEN tables

-- Loop through all the tables in the database
FETCH NEXT
FROM tables
INTO @tablename

WHILE @@FETCH_STATUS = 0
BEGIN
-- Do the showcontig of all indexes of the table
INSERT INTO #fraglist
EXEC ('DBCC SHOWCONTIG (''' + @tablename + ''')
WITH FAST, TABLERESULTS, ALL_INDEXES, NO_INFOMSGS')
FETCH NEXT
FROM tables
INTO @tablename
END

-- Close and deallocate the cursor
CLOSE tables
DEALLOCATE tables

-- Declare cursor for list of indexes to be defragged
DECLARE indexes CURSOR FOR
SELECT ObjectName, ObjectId, IndexName, IndexId, ScanDensity
FROM #fraglist
WHERE ScanDensity <= @maxfrag
AND INDEXPROPERTY (ObjectId, IndexName, 'IndexDepth') > 0


-- Open the cursor
OPEN indexes

-- loop through the indexes
FETCH NEXT
FROM indexes
INTO @TableName, @ObjID, @IxName, @IxId, @ScanDensity

WHILE @@FETCH_STATUS = 0
BEGIN
set @Query = 'DBCC IndexDefrag (0,' + rtrim(@tablename) +','+ rtrim(@IxName) + ') with no_infomsgs --Current ScanDensity = ' + rtrim(@ScanDensity)
print @Query
EXEC sp_executesql @Query
FETCH NEXT
FROM indexes
INTO @TableName, @ObjID, @IxName, @IxId, @ScanDensity
END
CLOSE indexes
DEALLOCATE indexes

-- Delete the temporary table
DROP TABLE #fraglist
GO

When:
Defragmentation of indexes can be done while the table is used by other people. However it will have a negative impact on performance because all indexes in the table are retrieved and updated. Therefore this can be scheduled on a weekly basis when the use of the system is minimal. For instance during the weekend.

Conclusion:
However SQL Server is largely self-configuring, self-tuning, and self-managing some maintenance is still necessary to get better performance. Defragmentation of clustered indexes and Update statistics of most important tables with full scan should be done manually if necessary. Defragmentation of indexes should be done on a weekly basis and can be scheduled.

Wednesday, March 18, 2009

Performance improvement for parameterized queries in SQL Server 2008: Optimze for Unknown

Parameterized queries are a well known SQL Server practice. This technique ensures caching and reuse of existing query execution plans (instead of constantly compiling new plans). This will improve performance of your application. However it can have a negative impact if the initial parameter is not representative of the values passed in the subsequent re-execution of the query. For the initial query, SQL Server compiled and cached a 'good' plan for the first parameter value. However this 'good' cached execution plan is performing very badly for all subsequent parameters values. The overall performance of this parameterized query depends on the parameter which is used for the first time. This is out of the control of the developer.


In SQL 2008 a new query hint option is introduced which is called: Optimize for Unknown

This hint directs the query optimizer to use the standard algorithms it has always used if no parameters values had been passed to the query at all. In this case the optimizer will look at all available statistical data to reach a determination of what the values of the local variables used to generate the query plan should be, instead of looking at the specific parameter values that were passed to the query by the application.

To further explain I will use a script which can be used in SQL 2008

CREATE DATABASE TEST

SET STATISTICS PROFILE OFF
GO
USE TEST
GO
-- Create a table with content.
CREATE TABLE Test(COL1 INT, COL2 CHAR(4),COL3 VARCHAR(25))
DECLARE @COL1 int, @COL2 INT
SET @COL1 = 0
WHILE @COL1 < 10000
BEGIN
INSERT INTO Test(col1,col2,col3) VALUES (@COL1,'Scan','THIS IS A TEST')
SET @COL1 = @COL1 + 1
END

SET @COL2 = @COL1
WHILE @COL2 < @COL1 + 11
BEGIN
INSERT INTO Test(COL1,COL2,COL3) VALUES (@COL2,'Seek','THIS IS A TEST')
SET @COL2 = @COL2 + 1
END
GO

-- Create indexes on generated table
CREATE UNIQUE CLUSTERED INDEX IX_CLUS ON TEST(COL1)
CREATE INDEX IX_2 ON TEST(COL2)
GO

DBCC SHOW_STATISTICS(TEST,IX_2) WITH HISTOGRAM
-- Show statistics for index IX_2.
-- How many times do the values for Column2 occur.
-- 'Seek' 11 times
-- 'Scan' 10000 times
GO

-- Stored procedure with SQL 2005\2000 behavior
CREATE PROCEDURE SLAP (@COL2 CHAR(4)) AS
SELECT COL3
FROM Test
WHERE COL2 = @COL2
GO

-- Stored procedure with SQL 2008
--Optimize for Unknown behavior
CREATE PROCEDURE COOL (@COL2 CHAR(4)) AS
SELECT COL3
FROM Test
WHERE COL2 = @COL2 OPTION (OPTIMIZE FOR (@COL2 UNKNOWN))
GO

-- Stored procedure with SQL 2008
-- Optimize for configured parameter value behavior
CREATE PROCEDURE COOLParDef (@COL2 CHAR(4)) AS
SELECT COL3
FROM Test
WHERE COL2 = @COL2 OPTION (OPTIMIZE FOR (@COL2 = 'Seek'))
GO

-- Display execution plan after execution
SET STATISTICS PROFILE ON

-- Clear procedure cache
DBCC FREEPROCCACHE

-- Start demo SQL 2000/2005 behavior
EXEC SLAP Seek -- Parameter 'Seek' is leading for query plan.
--It will use an Index Seek

GO

EXEC SLAP Scan
-- Stored procedure SLAP is executed for parameter value 'Scan'
--with an Index Seek (cached)


GO
-- Clear procedure cache
DBCC FREEPROCCACHE
EXEC SLAP Scan
-- Parameter 'Scan' is leading for query plan.
--It will use an Index Scan
GO
EXEC SLAP Seek
-- Stored procedure SLAP is executed for parameter value 'Seek'
--with an Index Scan (cached)
GO

DBCC FREEPROCCACHE
GO
EXEC COOL Seek
-- Stored procedure COOL is executed for parameter value 'Seek'
-- with an Index Scan.
-- Parameter value 'Seek' is ignored and the statistics are used. In this case value scan occurs 10.000 times.
-- Value Seek occurs only 11 times.
-- For overall performance of this query the Index Scan is the best.
GO
EXEC COOL Scan
GO

DBCC FREEPROCCACHE
GO
EXEC COOLParDef Scan
GO
-- Stored procedure is compiled with OPTIMIZE FOR (@COL2 = 'Seek'
-- Execution plan is always based on the parameter value 'Seek'
GO
EXEC COOLParDef Seek

-- Clean up all created stuff
USE MASTER
GO
DROP DATABASE TEST


Conclusion: This Optimize for Unknown option is a performance improvement. However I do not understand why this option is not default bahviour. Has somebody experience (good or bad) with this parameter?

Friday, March 6, 2009

What is the syntax of the query which is locking data?

Image Amagill

In live SQL environments queries can be locked by other queries. In the tables master..sysprocesses you can see by which SPID is blocking your query: 
SELECT Blocked FROM Master..Sysprocesses WHERE Blocked <> Spid and Blocked <> 0

However it is nice to know which SPID is blocking, but it more interesting to know what the syntax is of this blocking query. With next script you can retrieve the query syntax of the Spid which is locking the data.


SET NOCOUNT ON

DECLARE DB CURSOR FOR -- Select all SPID's which creates a lock
SELECT SP.blocked, SB.Name
FROM Master..Sysprocesses SP
INNER JOIN Master..Sysdatabases SB ON SP.DBID = SB.DBID
WHERE SP.blocked <> 0 AND SP.blocked <> SP.spid

OPEN DB
DECLARE @LOCKSPID Nvarchar (10); -- Spid of locking transaction
DECLARE @DBNAME Nvarchar(256); -- Dbname in which a locked transaction is.
DECLARE @Handle Nvarchar(256);
DECLARE @SQL nvarchar(4000); -- Generated SQL Script which will be executed against all databases

FETCH NEXT FROM DB INTO @LOCKSPID,@DBNAME
WHILE @@FETCH_STATUS = 0
BEGIN

-- Generate SQL script for the first database in paramater @SQL
SET @Handle = '(Select sql_handle FROM Master..Sysprocesses WHERE Spid = ' + @LOCKSPID +')'
SET @SQL = 'SELECT Text FROM ::fn_get_sql('+ @Handle +')'
EXEC SP_EXECUTESQL @SQL -- Execute the generated script.

FETCH NEXT FROM DB INTO @LOCKSPID,@DBNAME -- Generate and execute script for the next locked query

END
CLOSE DB
DEALLOCATE DB


Previous script will work on SQL 2005 and SQL 2008. For SQL 2000 a hotfix is available.

Wednesday, March 4, 2009

Memory configurations for SQL 2005 and SQL 2008

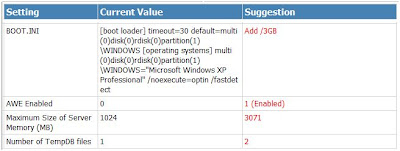
A lot of times I have seen SQL configurations at customer sites for which SQL Server could not use all available memory. For instance servers which uses only 2 GB of the available 8 GB of memory. This is something we need to avoid. In this blog I will advice which edition of SQL Server to buy of you need a new SQL Server.
 
SQL Server 2005\2008 can be used in different configurations.
  1. SQL 2005\2008 X86 edition on X86 (32 bits) operating system  
  2. SQL 2005\2008 X64 or IA 64 edition on X64 or IA 64 (64 bits) operating system
  3. SQL 2005\2008 X86 edition on X64 (64 bits) operating system
Wrong memory configurations always occur with the SQL 2005\2008 X86 versions. Memory configurations with SQL 2005\2008 X86 versions needed more configuration than SQL 2005\2008 X64 or IA64 versions.

The 32 bit versions of Windows Server are limited to 4 GB. 2 GB is reserved for the operating system and 2 GB is reserved for applications like SQL Server. With a standard installation of the operating system SQL can only uses 2 GB of memory.

Image credit: teclasorg


How to configure more than 2 GB memory for SQL Server on X86 (32 bits) version:
  • Add the /3GB switch to the BOOT.INI to force the operating system to use only 1 GB, while applications can use the remaining 3 GB. This switch is supported in Windows Server 2003 Standard, Enterprise and Datacenter editions.
  • For servers with more than 4 GB of memory add the /PAE switch to the BOOT.INI and enable AWE. It allows the operating system to access physical memory beyond 4 GB. This switch is supported in Windows Server 2003 Enterprise and Datacenter editions.
  • For servers with more than 16 GB you should add the /PAE switch to the BOOT.INI and enable AWE. Do not use the /3GB switch because the operating system need more than 1 GB of memory to handle and manage the allocation of 16 GB and above.
Before enabling AWE you must grant Lock Pages in Memory rights to the SQL Server account and set the 'max server memory' configuration option.
For more information about how to configure /3GB /PAE and to enable AWE see: Large memory support in Windows Server 2003 (X86 32 bits editions)

How to configure memory for SQL Server on X64 or IA 64 operating systems?
Windows Server 2003/2008 X64 support up to 32 GB of memory in Web and Standard editions.
Windows Server 2003/2008 X64 support up to 2 TB of memory in Enterprise and Datacenter editions.
Windows Server 2003 IA64 support up to 1 TB of memory.
Windows Server 2008 IA64 support up to 2 TB of memory.

All of these operating systems (X64 or IA64) use the available memory in the server without the need of /3GB, /PAE or AWE enabling. You only need to grant Lock Pages in Memory rights to the SQL Server account and set the 'max server memory' configuration option. Be aware that the AWE option is available in the X64 or IA 64 version but it will do nothing with it. It is a useless option on X64 and IA64.


How to configure memory for SQL Server X86 editions on X64 operating system?
It is possible but I do not know why you should do it. It has only disadvantages in comparison with a X64 edition of SQL Server. It will behave like a 32 bits system and need to map memory pages. This has a negative impact on performance. A 32 bits version of SQL Server on X64 operating system is the same as on an X86 operating system. You need to enable AWE and grant Lock Pages in Memory rights the SQL server account and set the 'max server memory' configuration option.

Conclusion:
64 bits versions of SQL Server on 64 bits operating systems are easier to configure, more scalable and performs better. Memory allocation on 64 bits system can be done directly without the need to map memory pages which is done in 32 bits operating systems. Today, all new hardware supports X64 installations. Therefore I have a simple advice when you need to invest in a new SQL Server:

For servers with more than 4 GB memory install the X64 or IA 64 version of SQL Server on a X64 or IA 64 operating system.

Wednesday, February 4, 2009

Guidelines to write well performing queries.

During my daily work I have done a lot of performance analyzes at customer sites. One part of a performance analyze is analyzing resource intensive queries on the database. For instance CPU usage, disk I/O. Sometimes these queries can be improved by rewriting the query without losing functionality. This blog contains the most common mistakes I have seen in bad performing queries.
Image credit: Dave Ward


  1. Avoid use of SELECT * in SQL queries. Retrieve only the columns you need. This will avoid bookmark lookups and will result in less data traffic from SQL server to client. Do you buy everything in the supermarket and at home throw away what you do not need?
    Example:
    SELECT ResourceID, FullName
    FROM Resources

    Instead of
    SELECT *
    FROM Resources
     
  2. Create only result sets when necessary. This will avoid unnecessary data retrieval. If you want to know if something exists it is not interesting to know how much time it exists.
    Example:
    IF EXISTS (SELECT 1 FROM Resources WHERE RESID > 1005)

    Instead of
    IF EXISTS (SELECT COUNT(*) FROM Resources WHERE RESID > 1005)


  3. Look to the execution plan of your query. It should contain an Index Seek instead of an Index Scan or Table Scan.
        
  4. Use parameterized queries for queries which will be used a lot. This will save unnecessary query plan generations and the Procedure cache is used more efficient.
    Example:
    SELECT FullName, PhoneNumber
    FROM Resources
    WHERE RESID=@P1

    Instead of
    SELECT FullName, PhoneNumber
    FROM Resources
    WHERE RESID=1005
     
  5. Write query with correct data type. Check data type of a column via sp_help <tablename>
    Example:Column ID Datatype INT
    SELECT Fullname
    FROM Resources
    WHERE RESID = 1005

    Instead of
    SELECT Fullname
    FROM Resources
    WHERE RESID = '1005'
     
  6. Avoid SQL roundtrips. Combine queries into one query. Buying a bottle of beer and chips bag at once is always faster than first buying a bottle of beer and go home and then go back to the supermarket to buy a chips bag.
    Example:
    Query 1: SELECT FullName FROM Resources WHERE ID = 1005
    Query 2: SELECT PhoneNumber FROM Resources WHERE ID = 1005

    Combined Query: SELECT FullName, PhoneNumber FROM Resources WHERE ID = 1005
     
  7. Remove JOINS which are not part of the SELECT or WHERE clause.

    SELECT A.Column2, A.Column3
    FROM Table1 A
    INNER JOIN Table2 B ON A.Column1 = B.Column5
    WHERE A.Column4 = 20

    Remove INNER JOIN Table2 B ON A.Column1 = B.Column5

    New query:
    SELECT A.Column2, A.Column3
    FROM Table1 A
    WHERE A.Column4 = 20
     
  8. JOIN a table on columns which are part of an index. In most cases one of the 2 columns is the primary key column.

    SELECT C.Name
    FROM Activities A
    INNER JOIN Contacts C ON C.ID A.ContactID
    WHERE A.TYPE = 10010002

    C.ID is the primary key column of table Contacts.
    A.ContactID is part of an index on table Activities.
     
  9. Avoid a lot of OR statements in the WHERE CLAUSE. Use a UNION. Because of the 3 different columns in the WHERE clause the clustered index will be used.

    Example: Table with Clustered index on ID and 3 indexes on: City, Type and the last one on Birthday. Next query will result in a clustered table scan.
    SELECT FullName
    FROM Resources
    WHERE City = 'Delft'
        OR Type = 1
        OR BirthDay > '2000-01-01'

    Next query will use the 3 indexes:
    SELECT FullName
    FROM Resources
    WHERE City = 'Delft'
    UNION ALL
    SELECT FullName
    FROM Resources
    WHERE Type = 1
    UNION ALL
    SELECT FullName
    FROM Resources
    WHERE BirthDay > '2000-01-01'
  10. Avoid ORDER BY columns which does not change the ORDER BY. This is unnecessary overhead.
    Example: Tabel Resources with Primary key on ID and Index 1 on RESID and Index 2 on FullName
    SELECT FullName FROM Resources
    WHERE City = 'Delft'
    ORDER BY RESID, FullName

    Remove the FullName in the ORDER BY. This will avoid an Index Scan on index FullName and a Hash Match
  11. Configure your SQL Server management Studio to connect Read Uncommitted to the database. By default SQL Server management Studio will connect Read Committed. By connecting Read Uncommitted, you will avoid that you lock colleagues or will be locked by other colleagues.  In SQL Server management Studio select: Tools, Options, Query Execution, SQL Server, Advanced, SET TRANSACTION ISOLATION LEVEL: Read Uncommitted).
     
  12. Test your queries on a database with enough content in it. Performance of a query on a table with only 10 records is always fast. It will only guarantee that the syntax of the query is correct. You can't make any conclusions of this query regarding performance. If your application should perform on a table with 1 million records. Test your queries on a table with 1 million records.
     
  13. Avoid using temporary tables. Creation of temporary tables can cost a lot of disk I/O.
     
  14. Use SET NOCOUNT ON at the beginning of SQL batches, Stored Procedures and Triggers.
     
  15. Define on every table a primary key. If you do not configure, SQL Server will do it in the background. This is additional overhead.
     
  16. Incomplete or over complete WHERE CLAUSES. Read the database documentation of the application to understand the business logic. Knowing the business logic you can define the correct WHERE clause.
     
  17. UPDATE multiple records in one query. For instance one update statement for 10 order lines:

    UPDATE OrderLines
    SET Modified = '2009-02-02 10:00:00.002'
    WHERE ID in(14235,14236,14237,14238,14239,14240,14241,14242,14243,14244)

    Instead of
    UPDATE OrderLines
    SET Modified = '2009-02-02 10:00:00.002'
    WHERE ID = 14235

    UPDATE OrderLines
    SET Modified = '2009-02-02 10:00:00.003'
    WHERE ID = 14236
    .
    .
    .
    UPDATE OrderLines
    SET Modified = '2009-02-02 10:00:00.013'
    WHERE ID = 14244